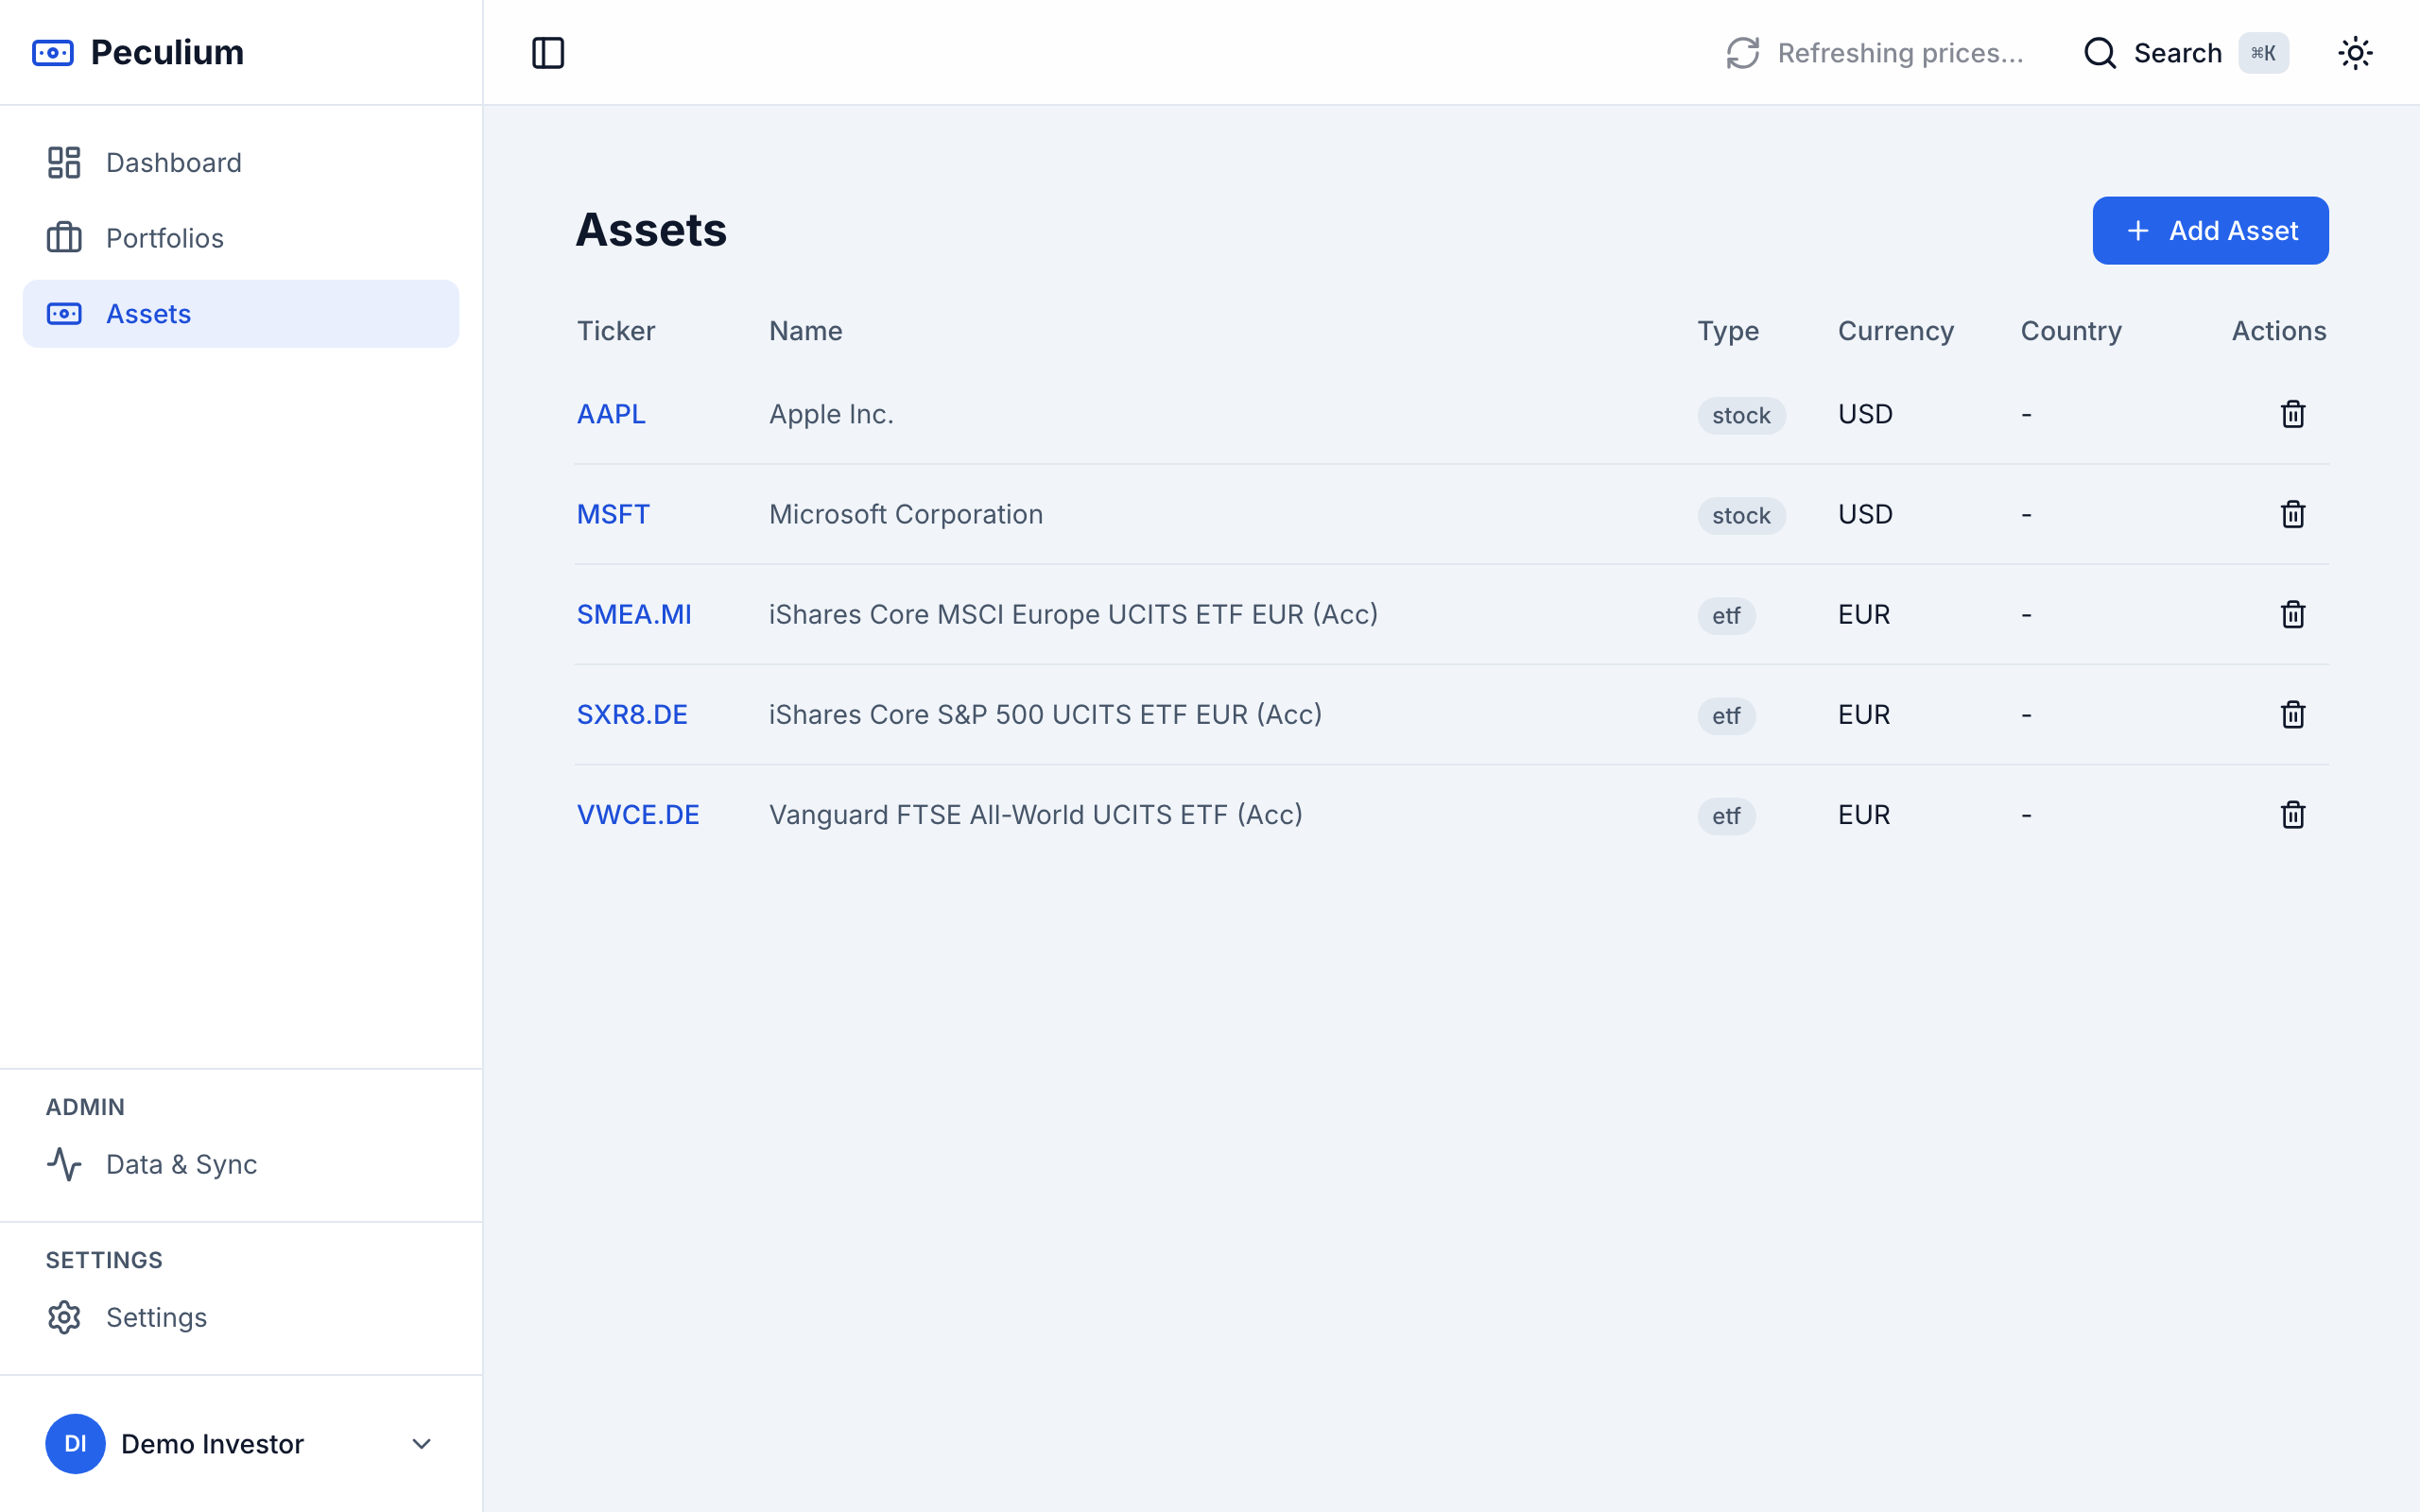
Features
A tour of what you get when you run Peculium on your own hardware — area by area.
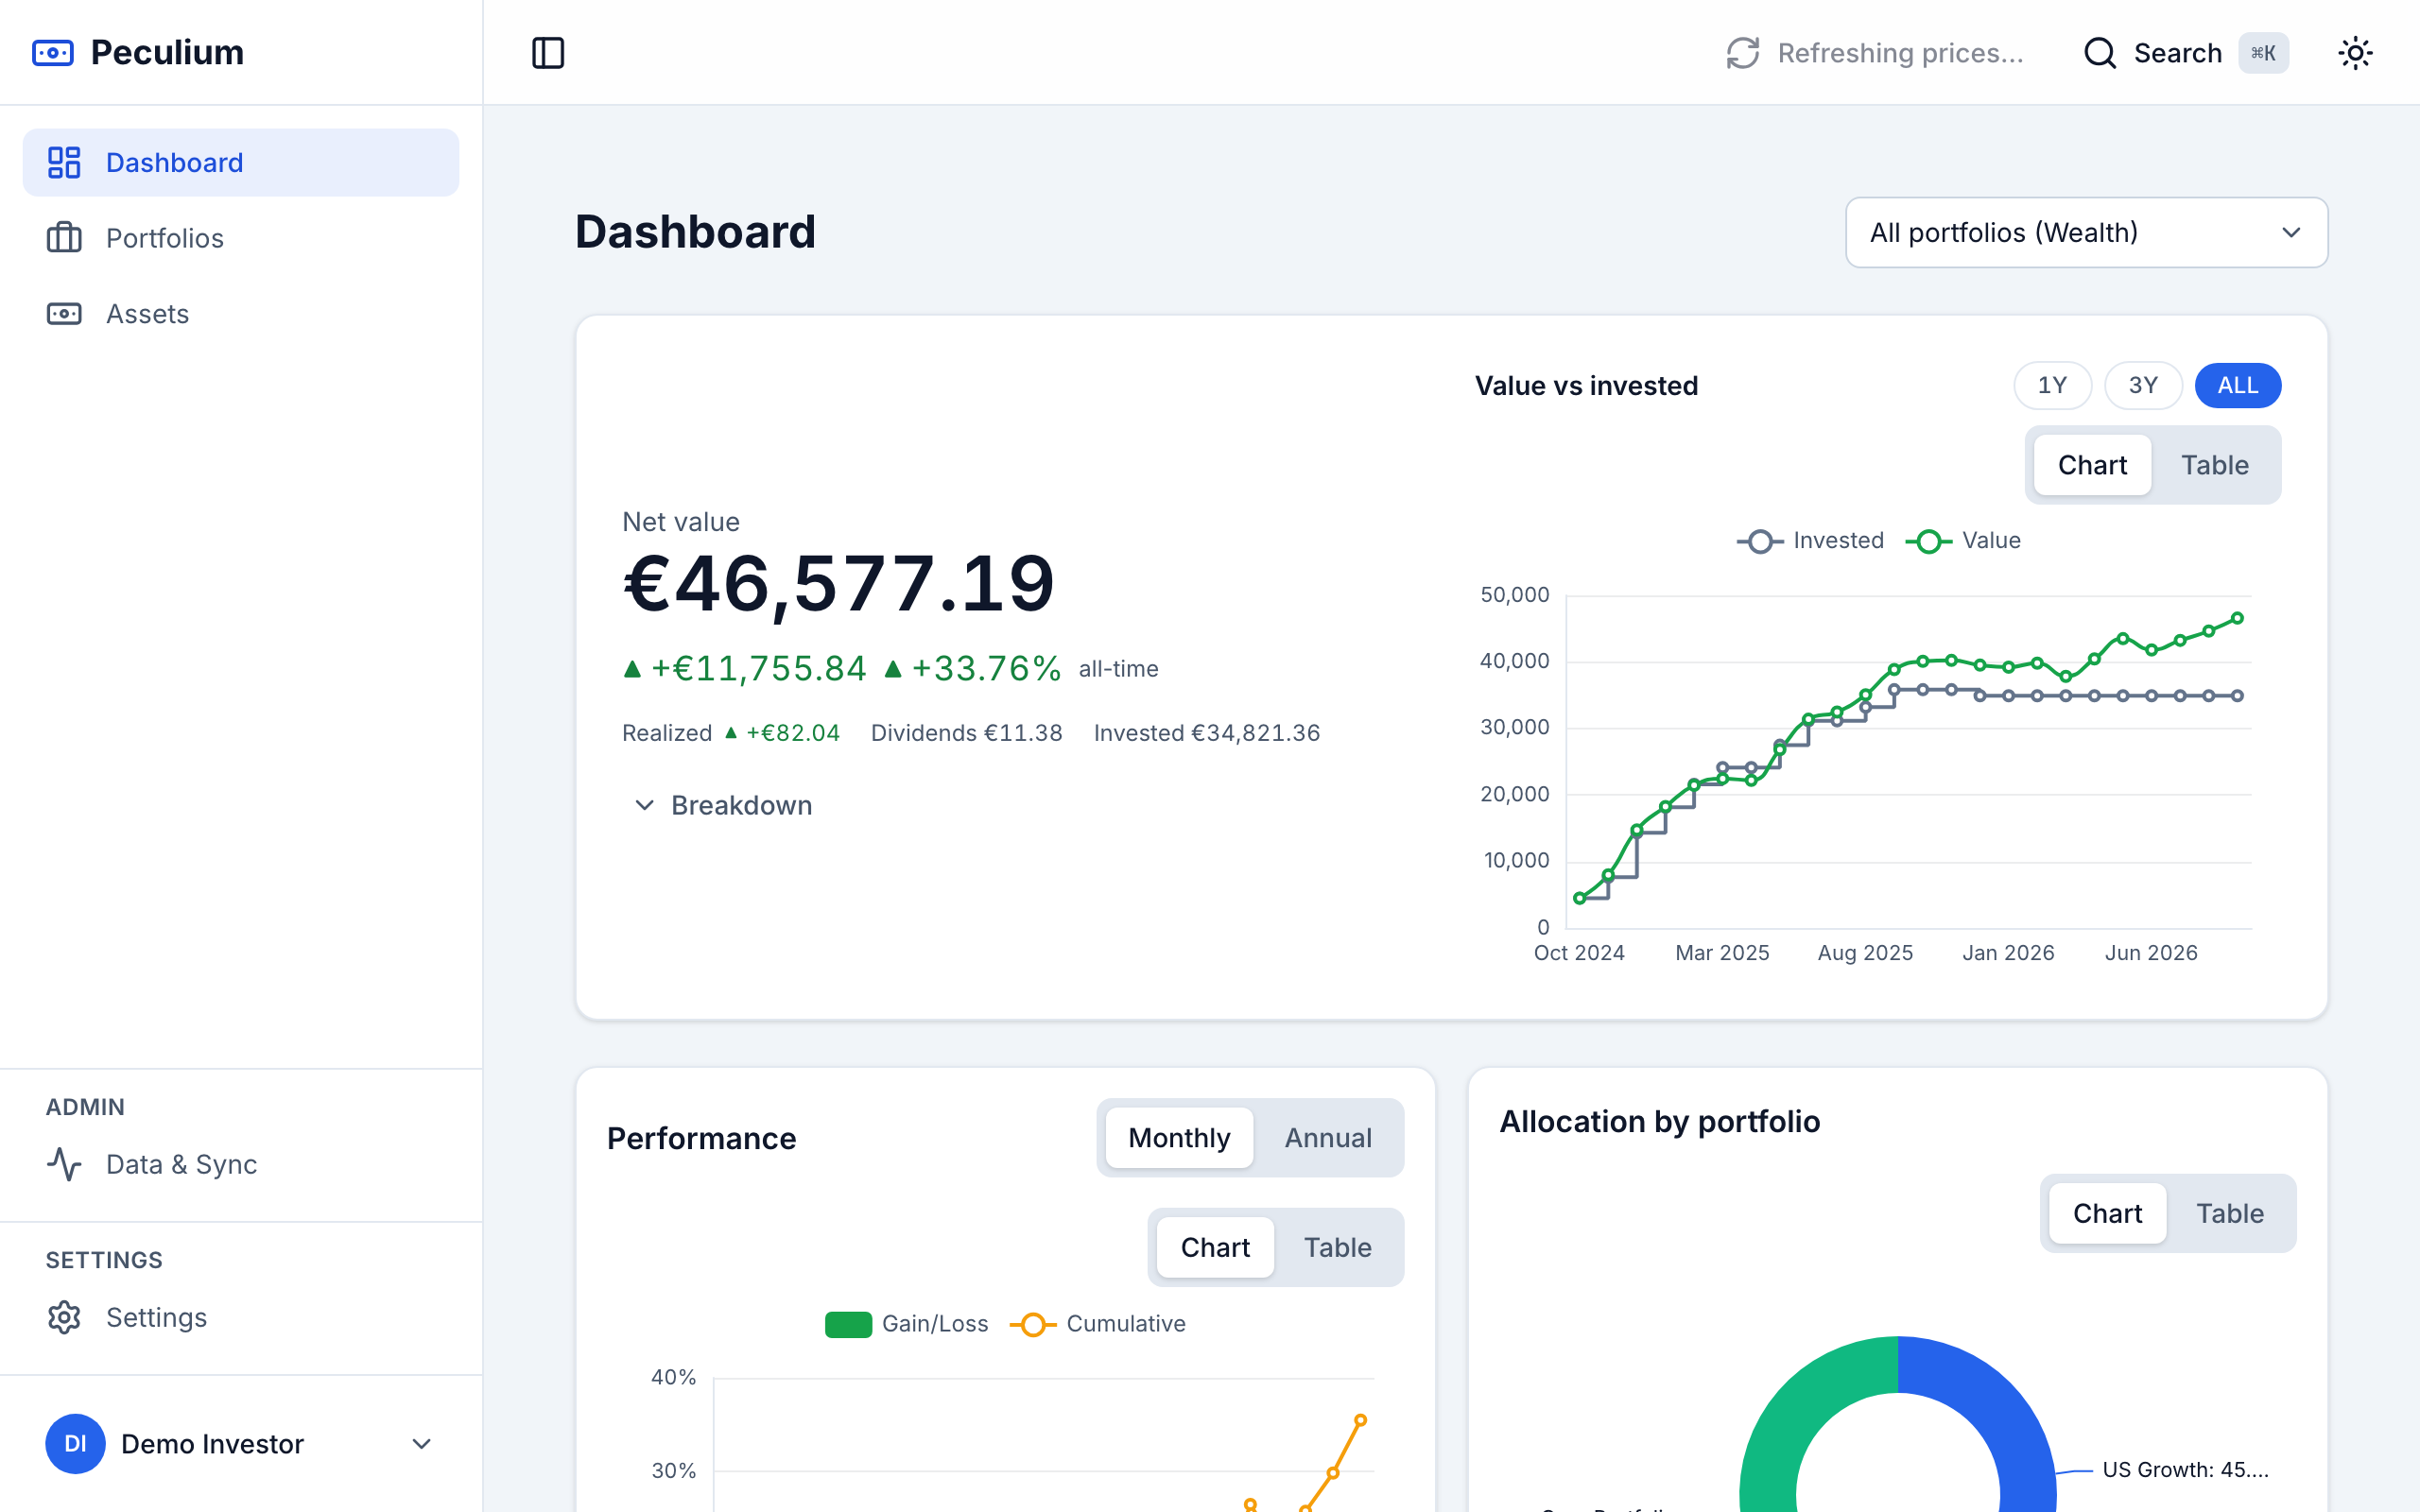
Portfolio & dashboard
Total value, gain/loss and ROI at a glance: allocation donuts, a performance line chart and per-asset ROI, aggregated across your portfolios or focused on a single one.
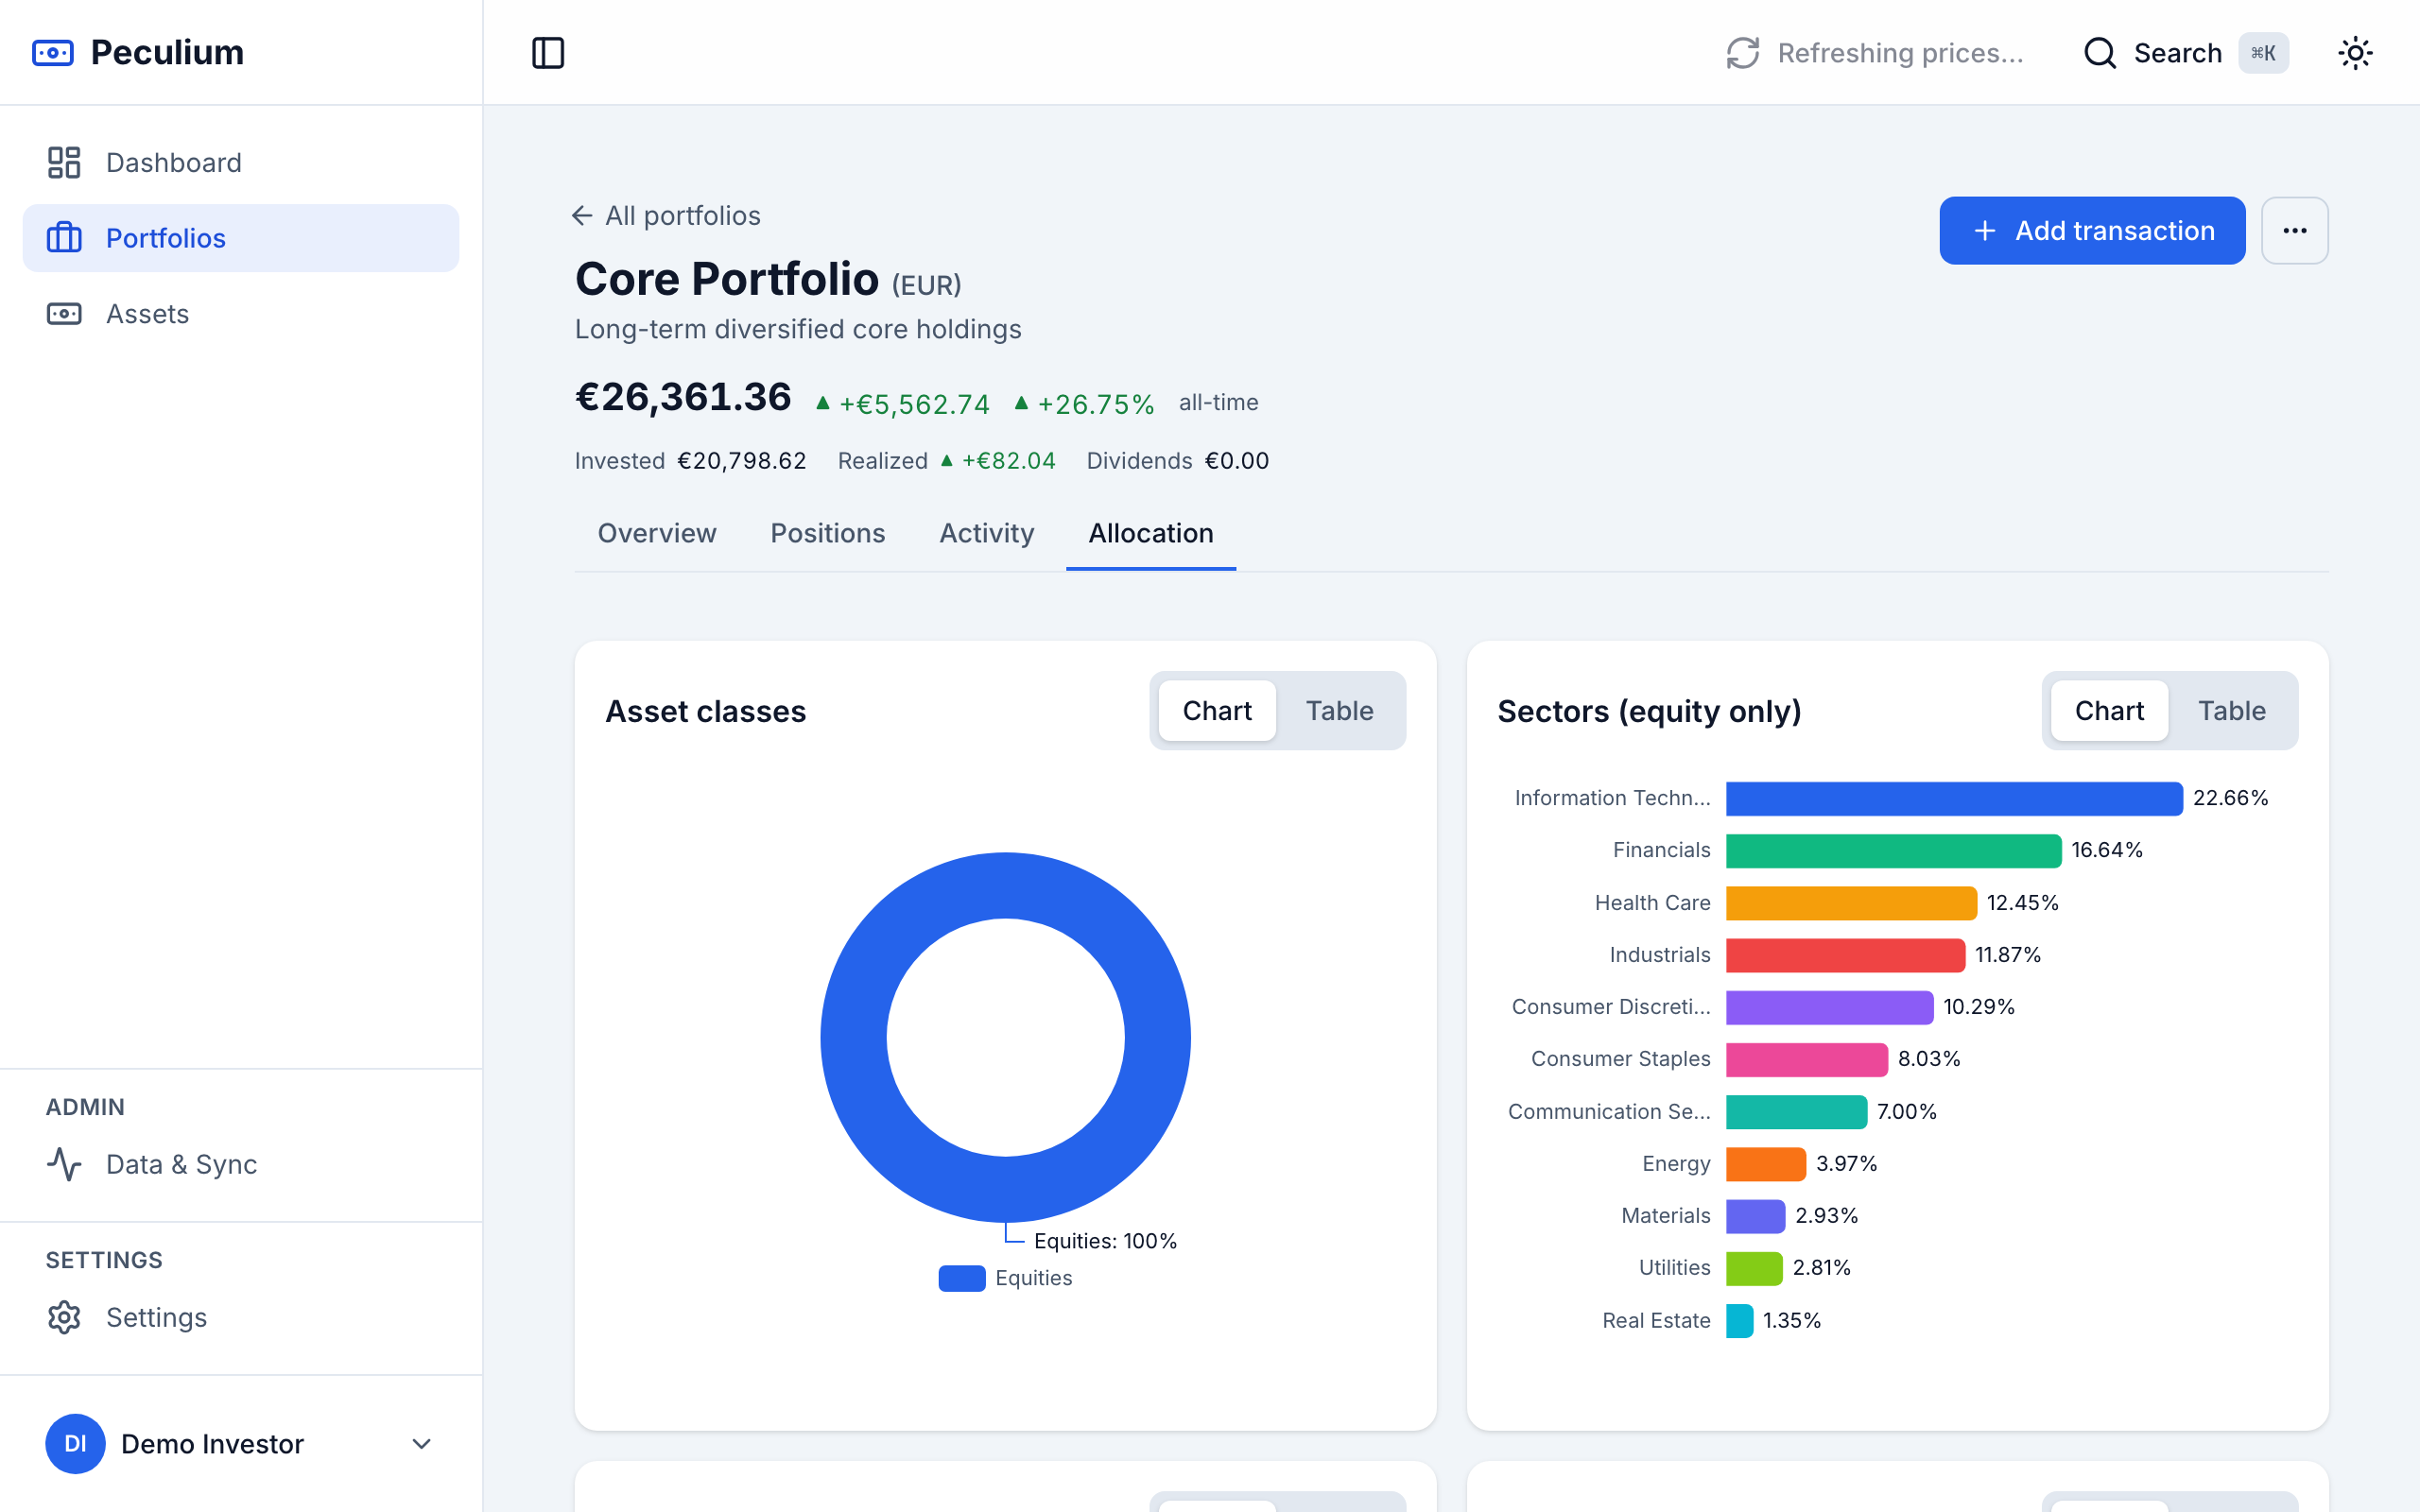
Allocations
Breakdown by asset class, geography and sector — overall or per portfolio, including ETF exposure imported per holding. Click a slice to drill down into the assets behind it, or switch any chart to its table view.
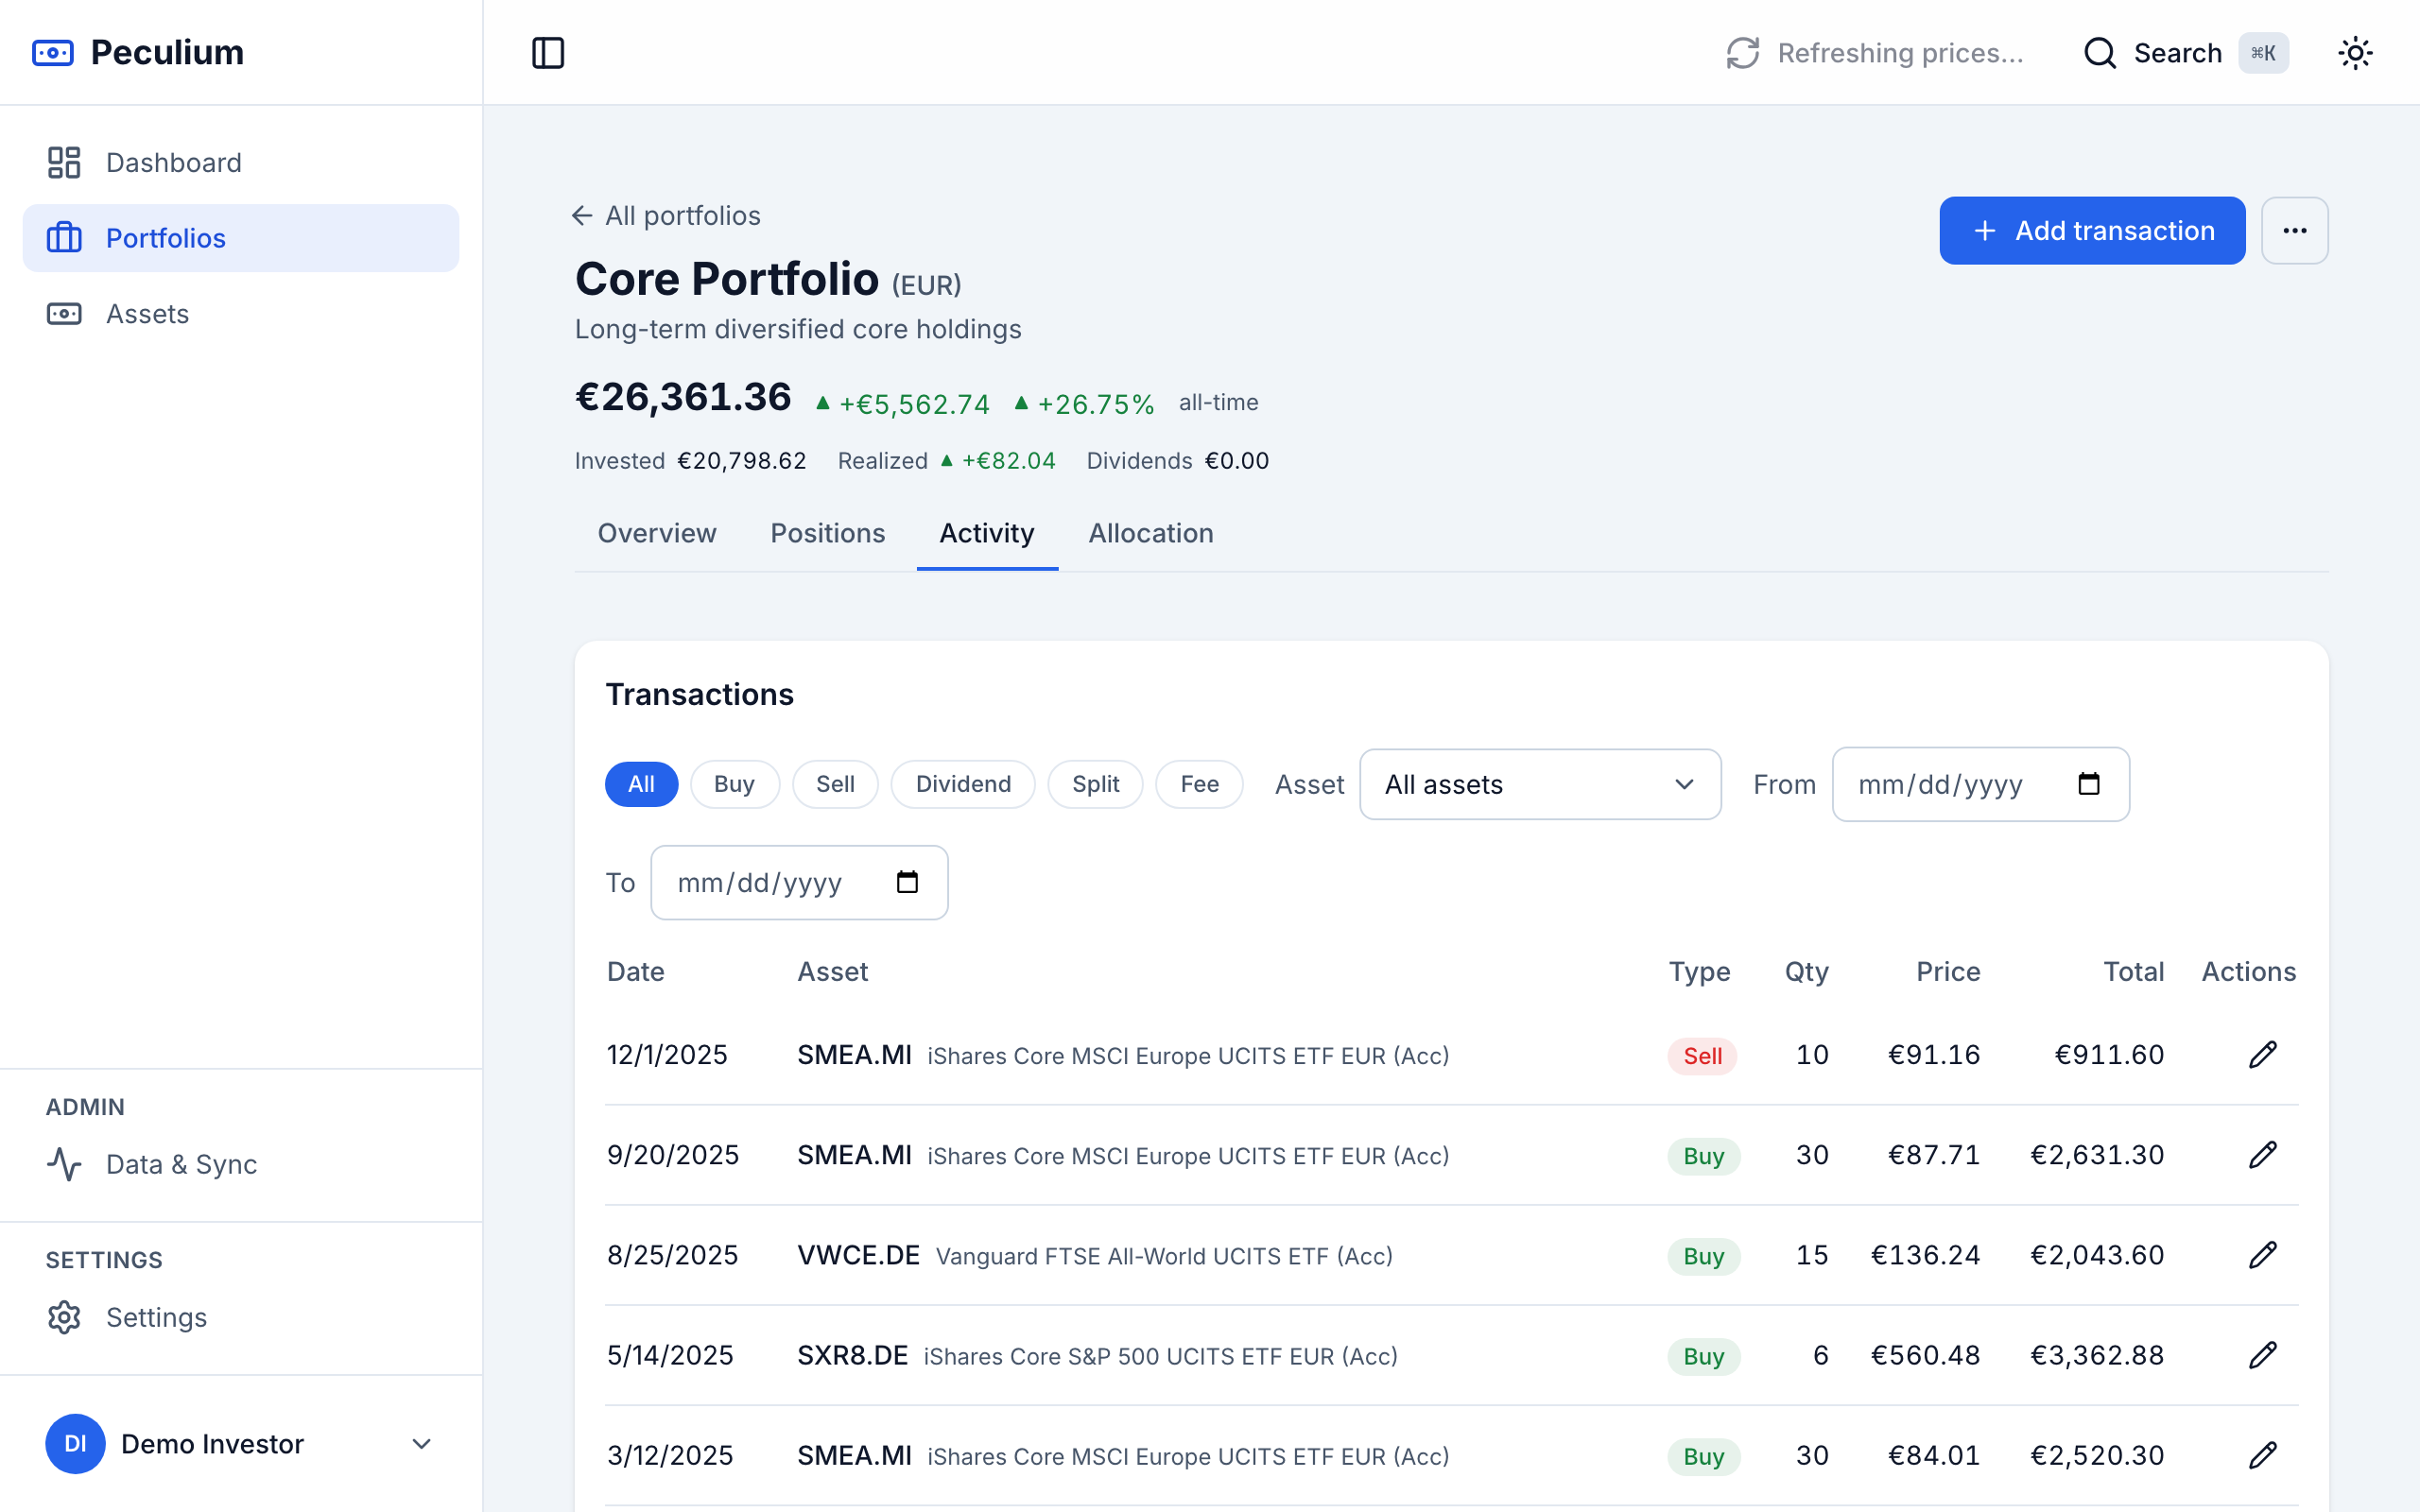
Transactions & history
Buy, sell and dividend transactions on every portfolio, with a filterable activity history that keeps ticker and asset name alongside each entry.
Asset detail & exposure
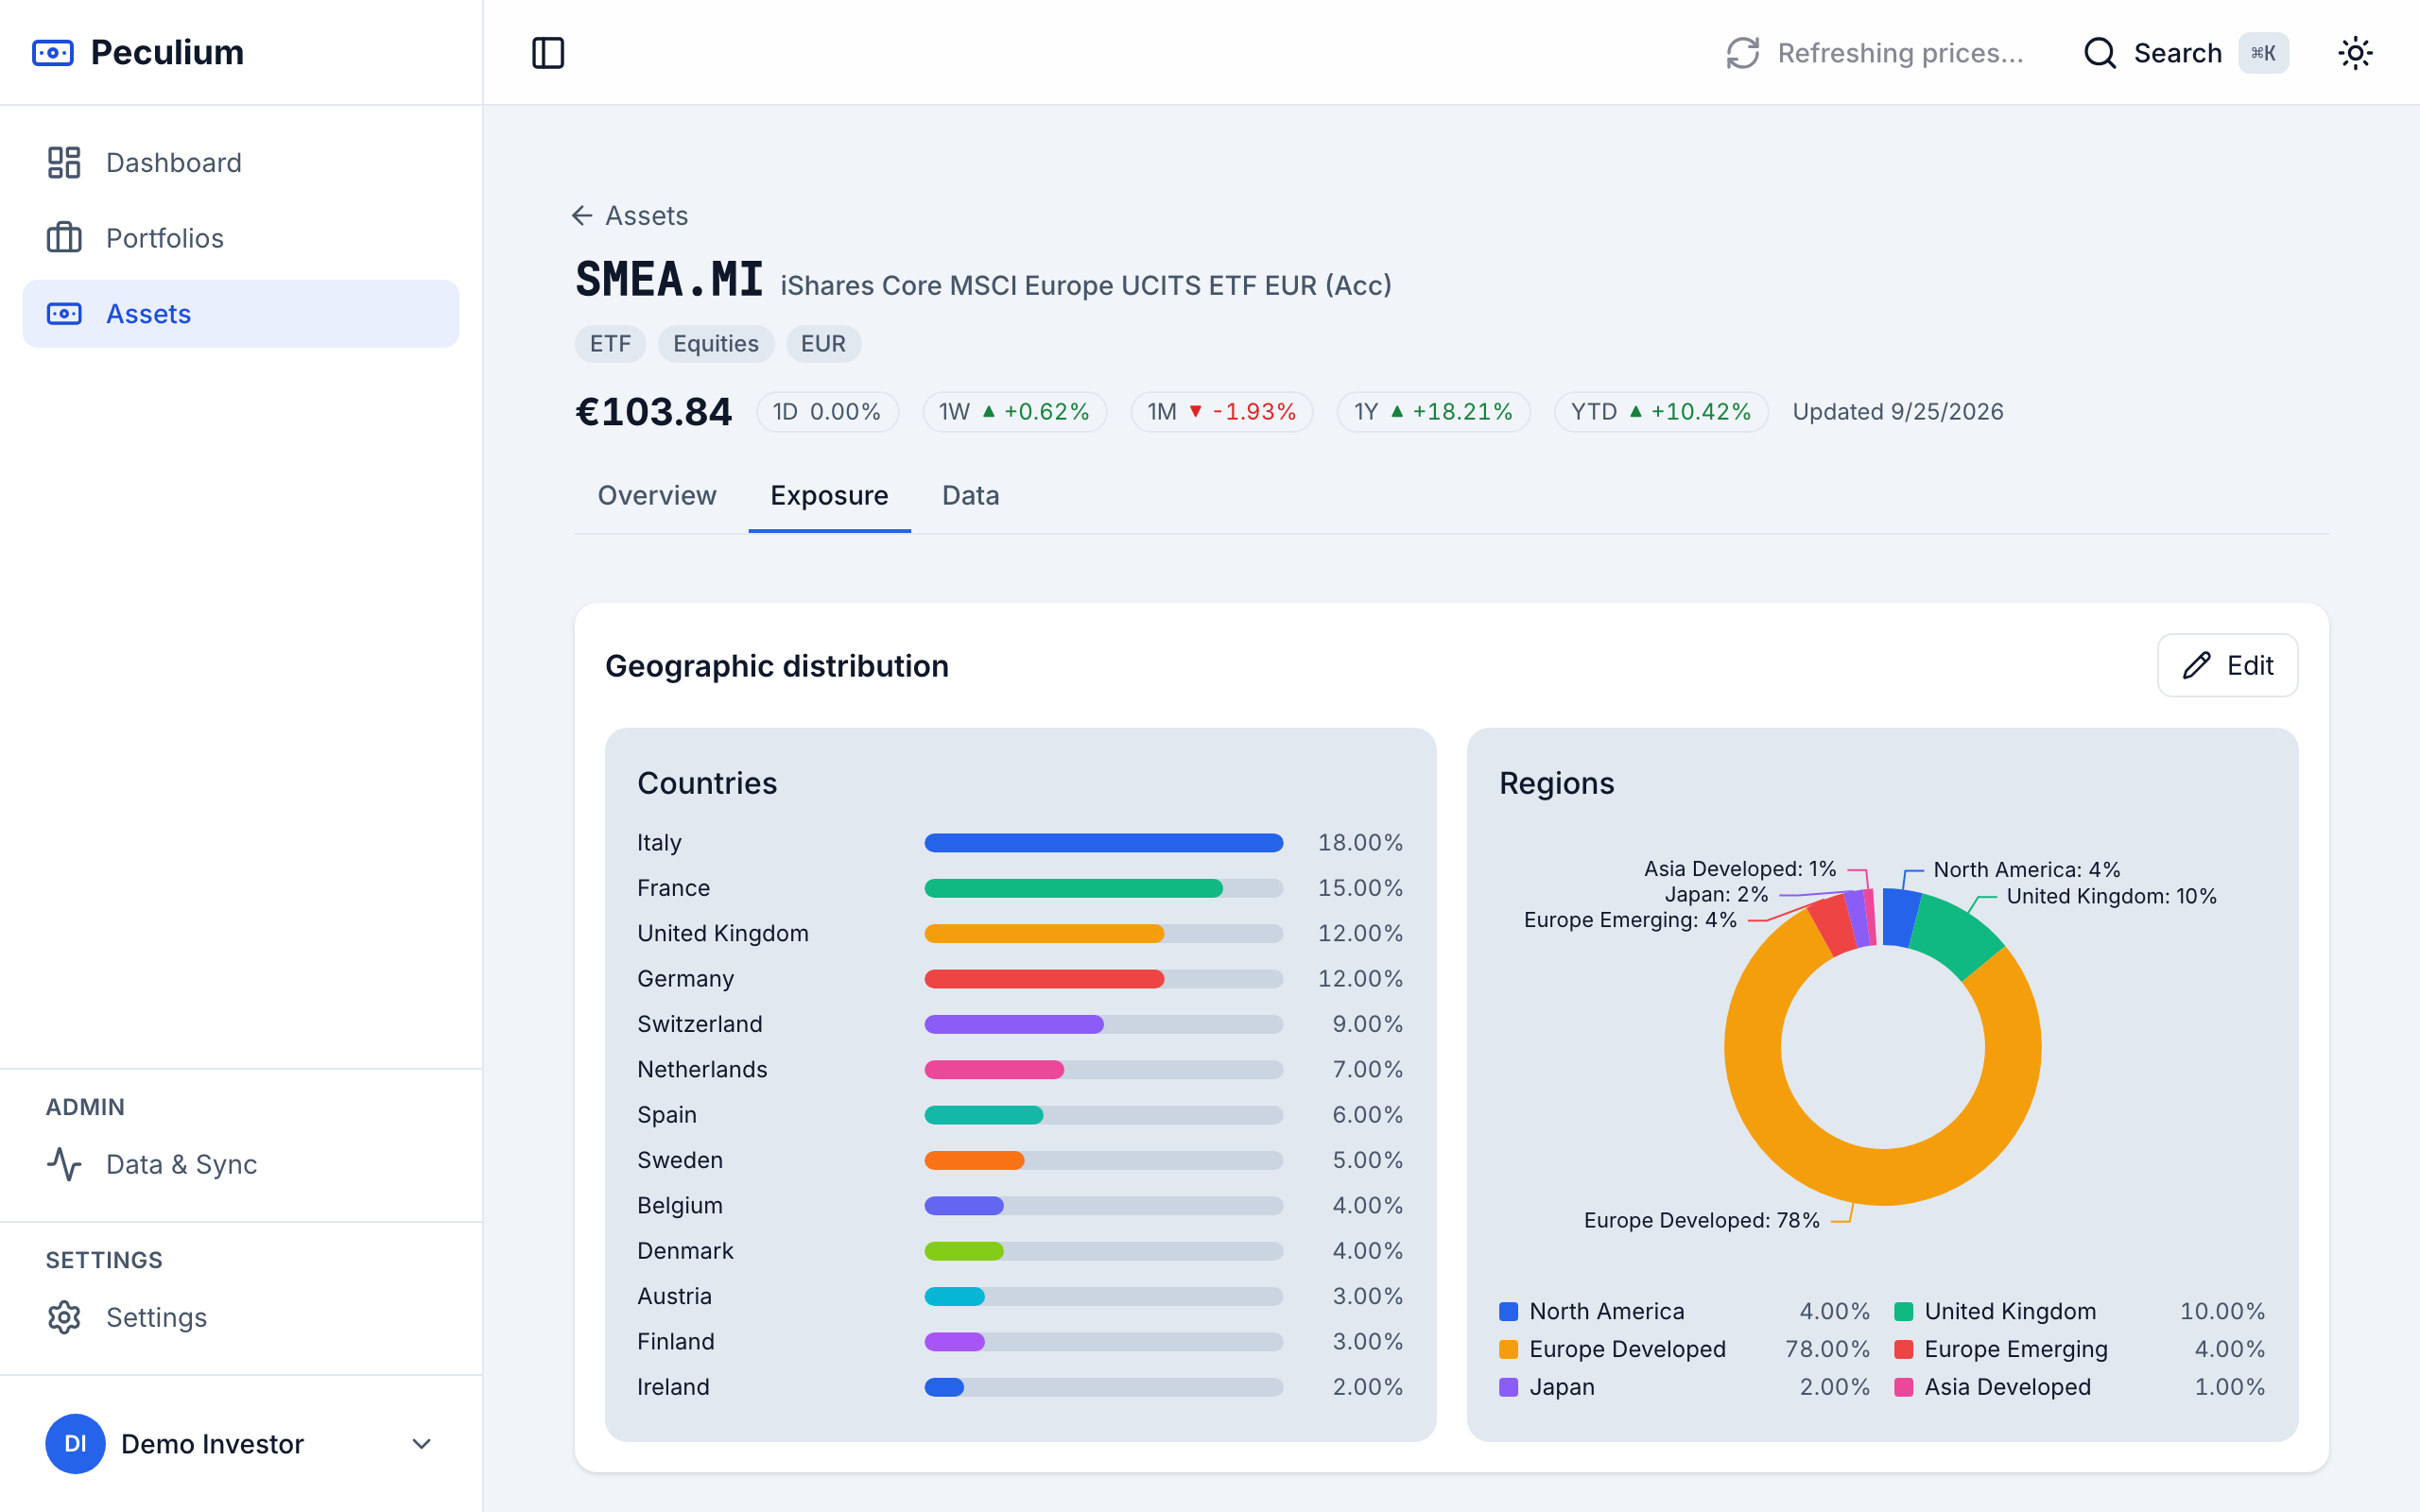
Per-asset page with editable metadata (exchange, ISIN), price-history backfill and editable geography/sector exposure tables next to their donut charts.
Data & sync / price health
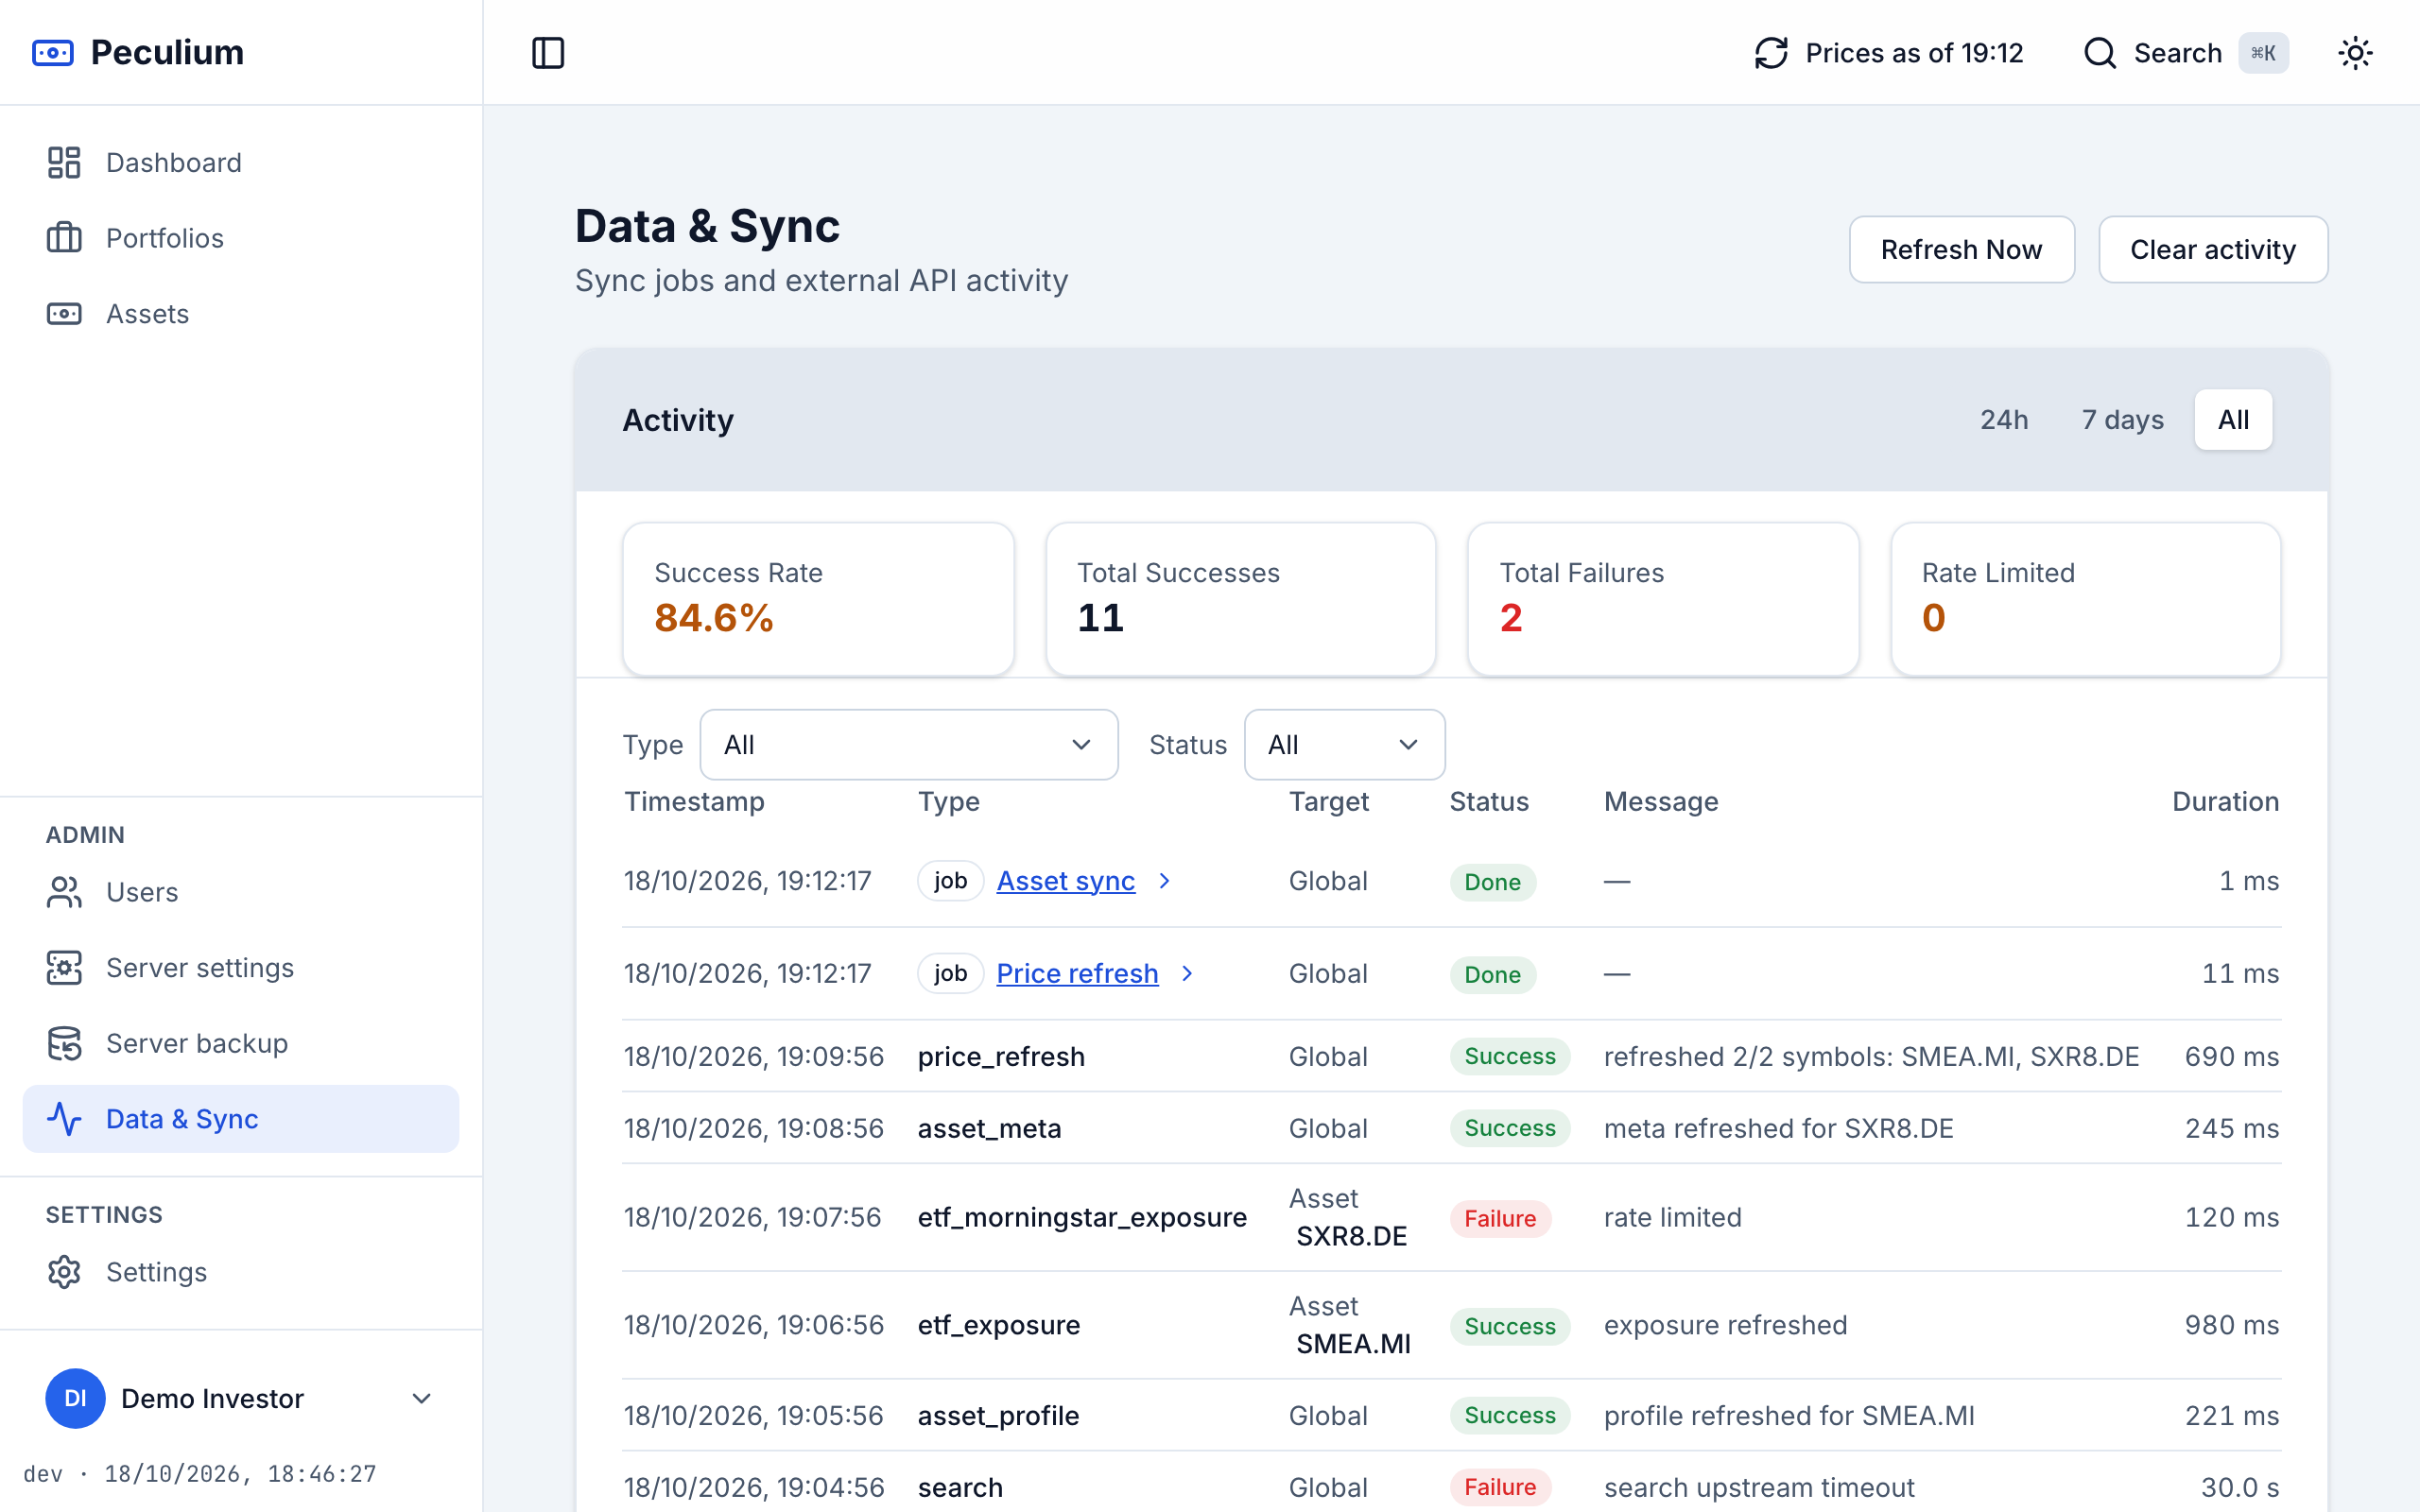
Ticker lookup and quotes from Yahoo Finance with on-demand refresh: the "Prices as of" stamp lives in the app header, and data-quality warnings (rate limits, failed updates, missing FX rates) follow you across pages.
Multi-currency
Assets quoted in different currencies are aggregated into a single view with FX rates applied, and holdings missing a rate are flagged instead of silently dropped.