
Dashboard & analytics
Everything you record in Daily use is computed for you; this chapter is how to read the result. The model behind the numbers lives in Concepts.
The dashboard
Right after login, the dashboard reports the whole picture: Net value, gain/loss (all-time) and Dividends, with the Breakdown of your Investments — invested, value / proceeds, gain/loss and realized, split into Active and Closed rows. Next to the headline numbers:
- the Value vs invested chart, with the 1Y / 3Y / ALL period chips;
- the Performance card: Monthly or Annual bars plus the Cumulative (time-weighted) line;
- the Allocation by portfolio donut, showing how your wealth is spread across your portfolios.
Use the Scope selector to focus the whole page on a single portfolio instead of the consolidated view.
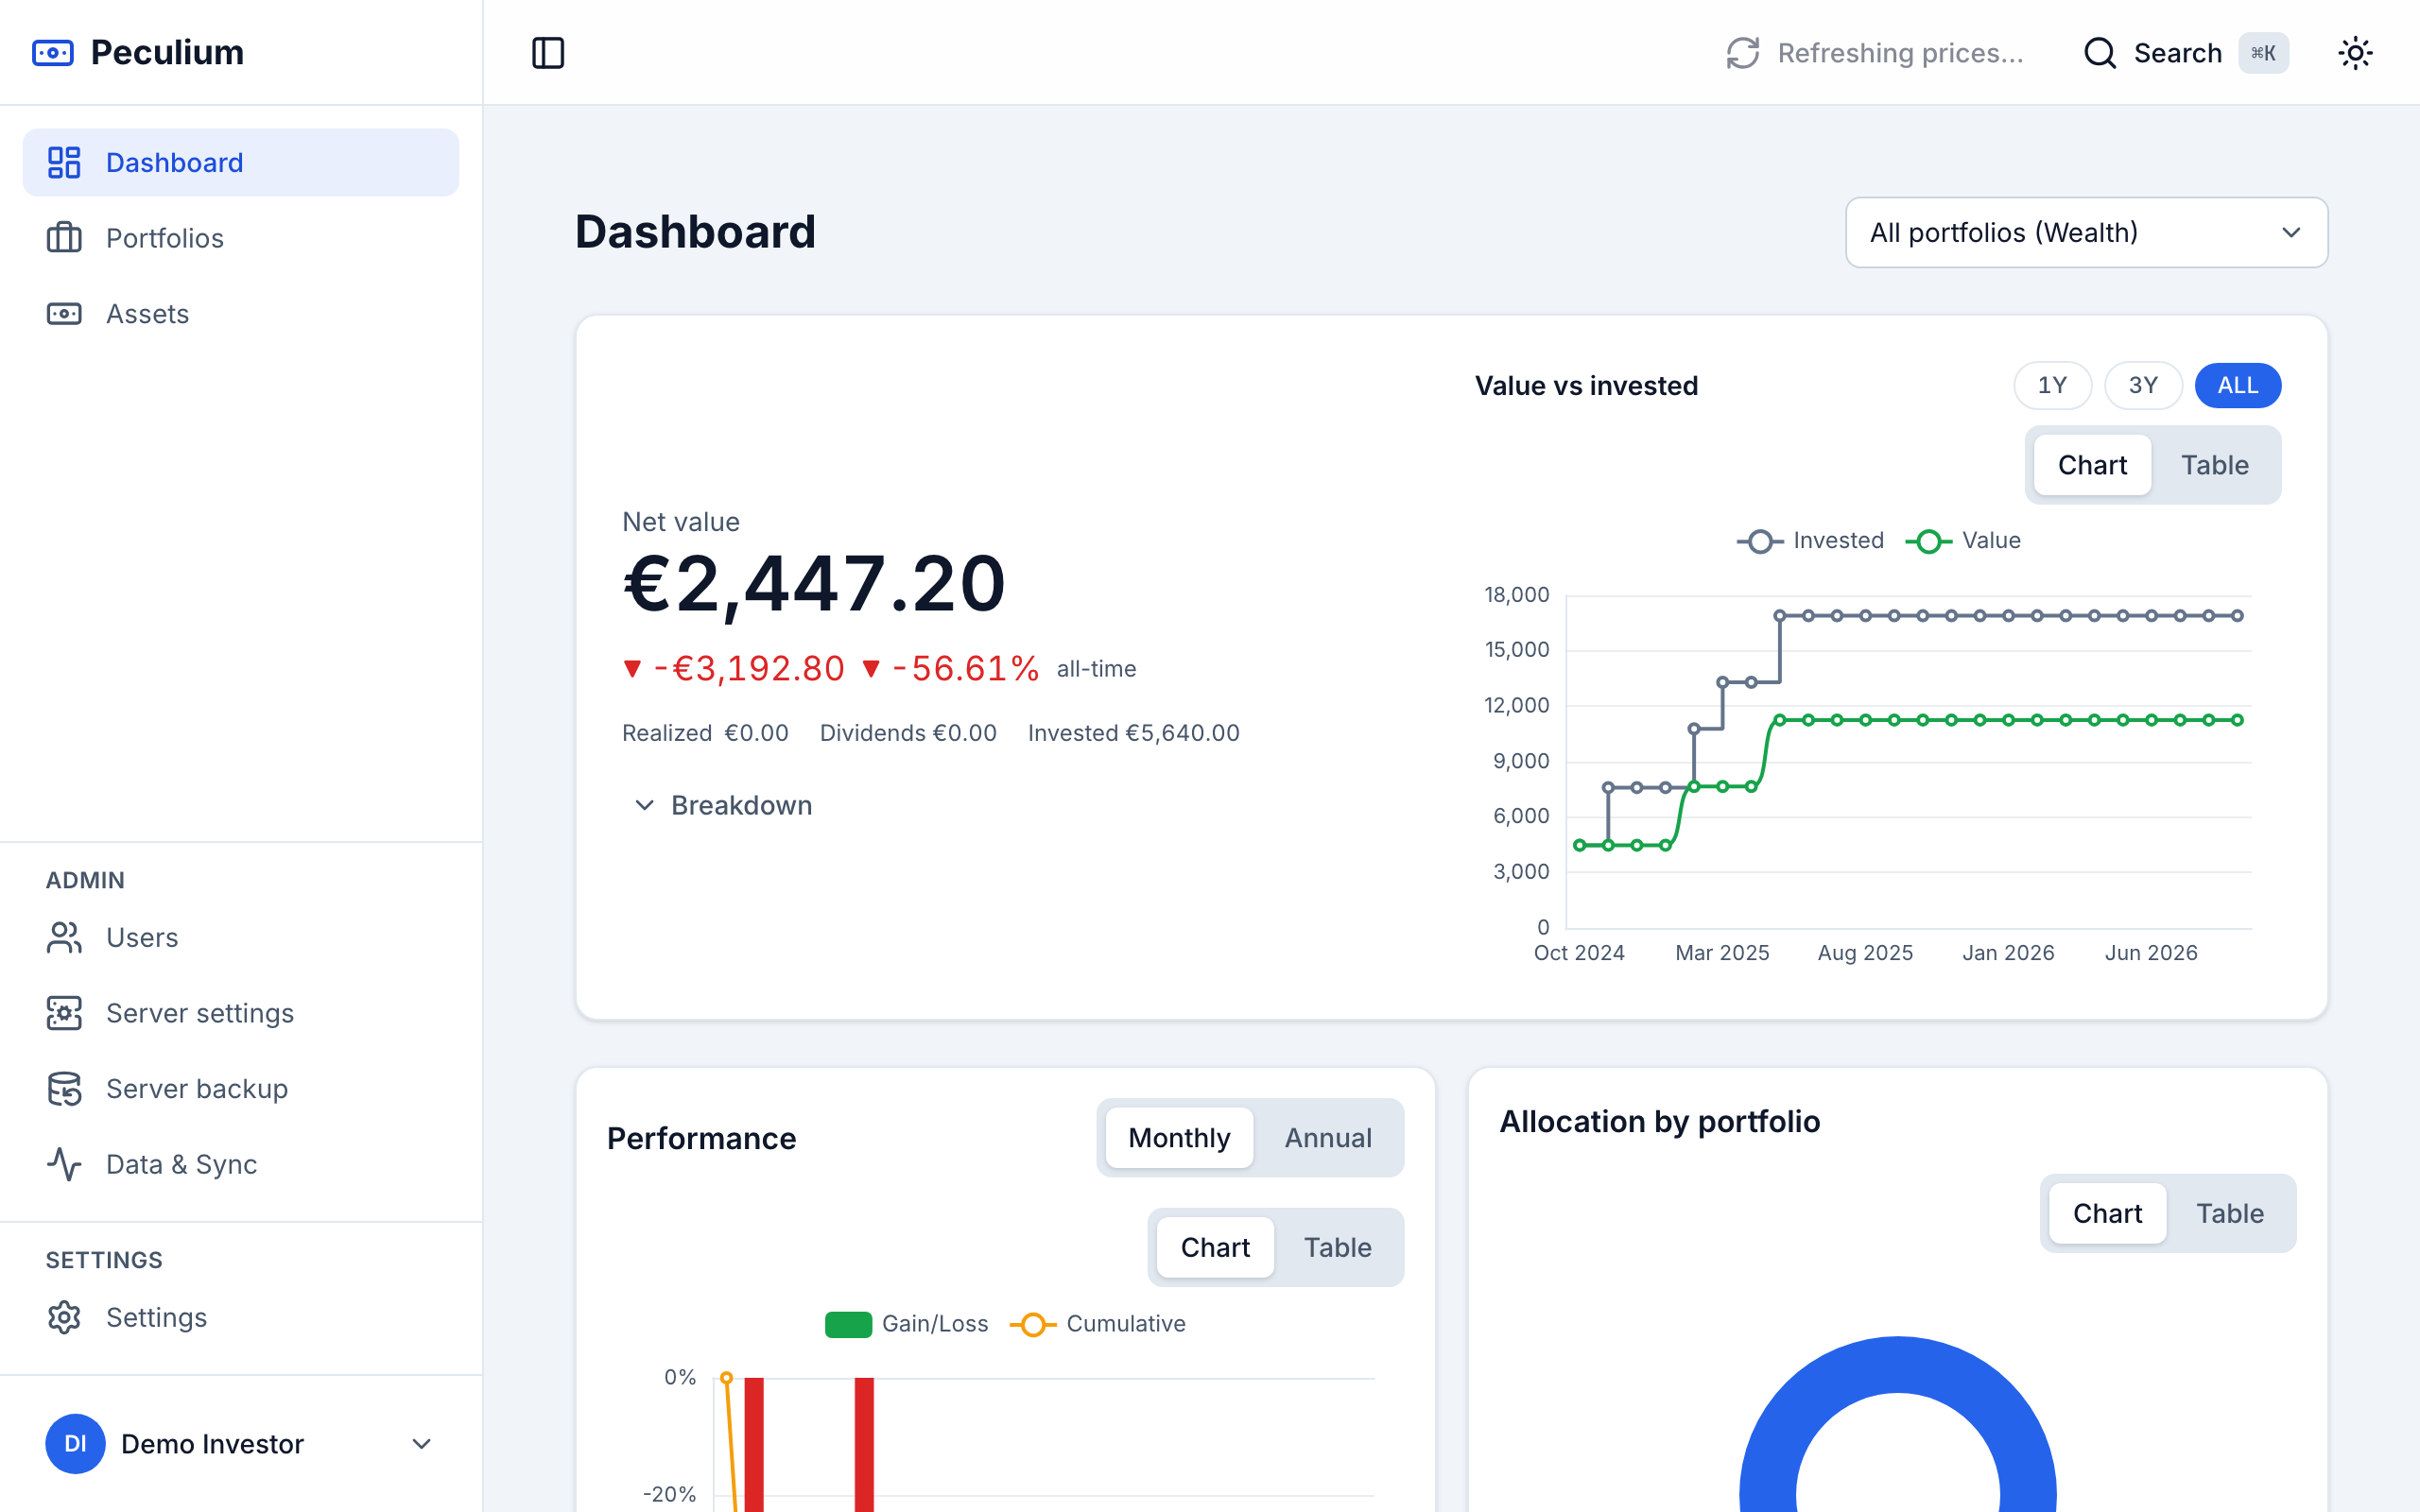
The dashboard — headline values, value-vs-invested chart, performance and allocation at a glance.
Portfolio detail
Opening a portfolio shows the same picture in miniature: its Overview tab carries the KPI strip — net value, invested, gain/loss, dividends, active vs closed — and that portfolio’s performance view. The other tabs are the Activity list and its allocation.
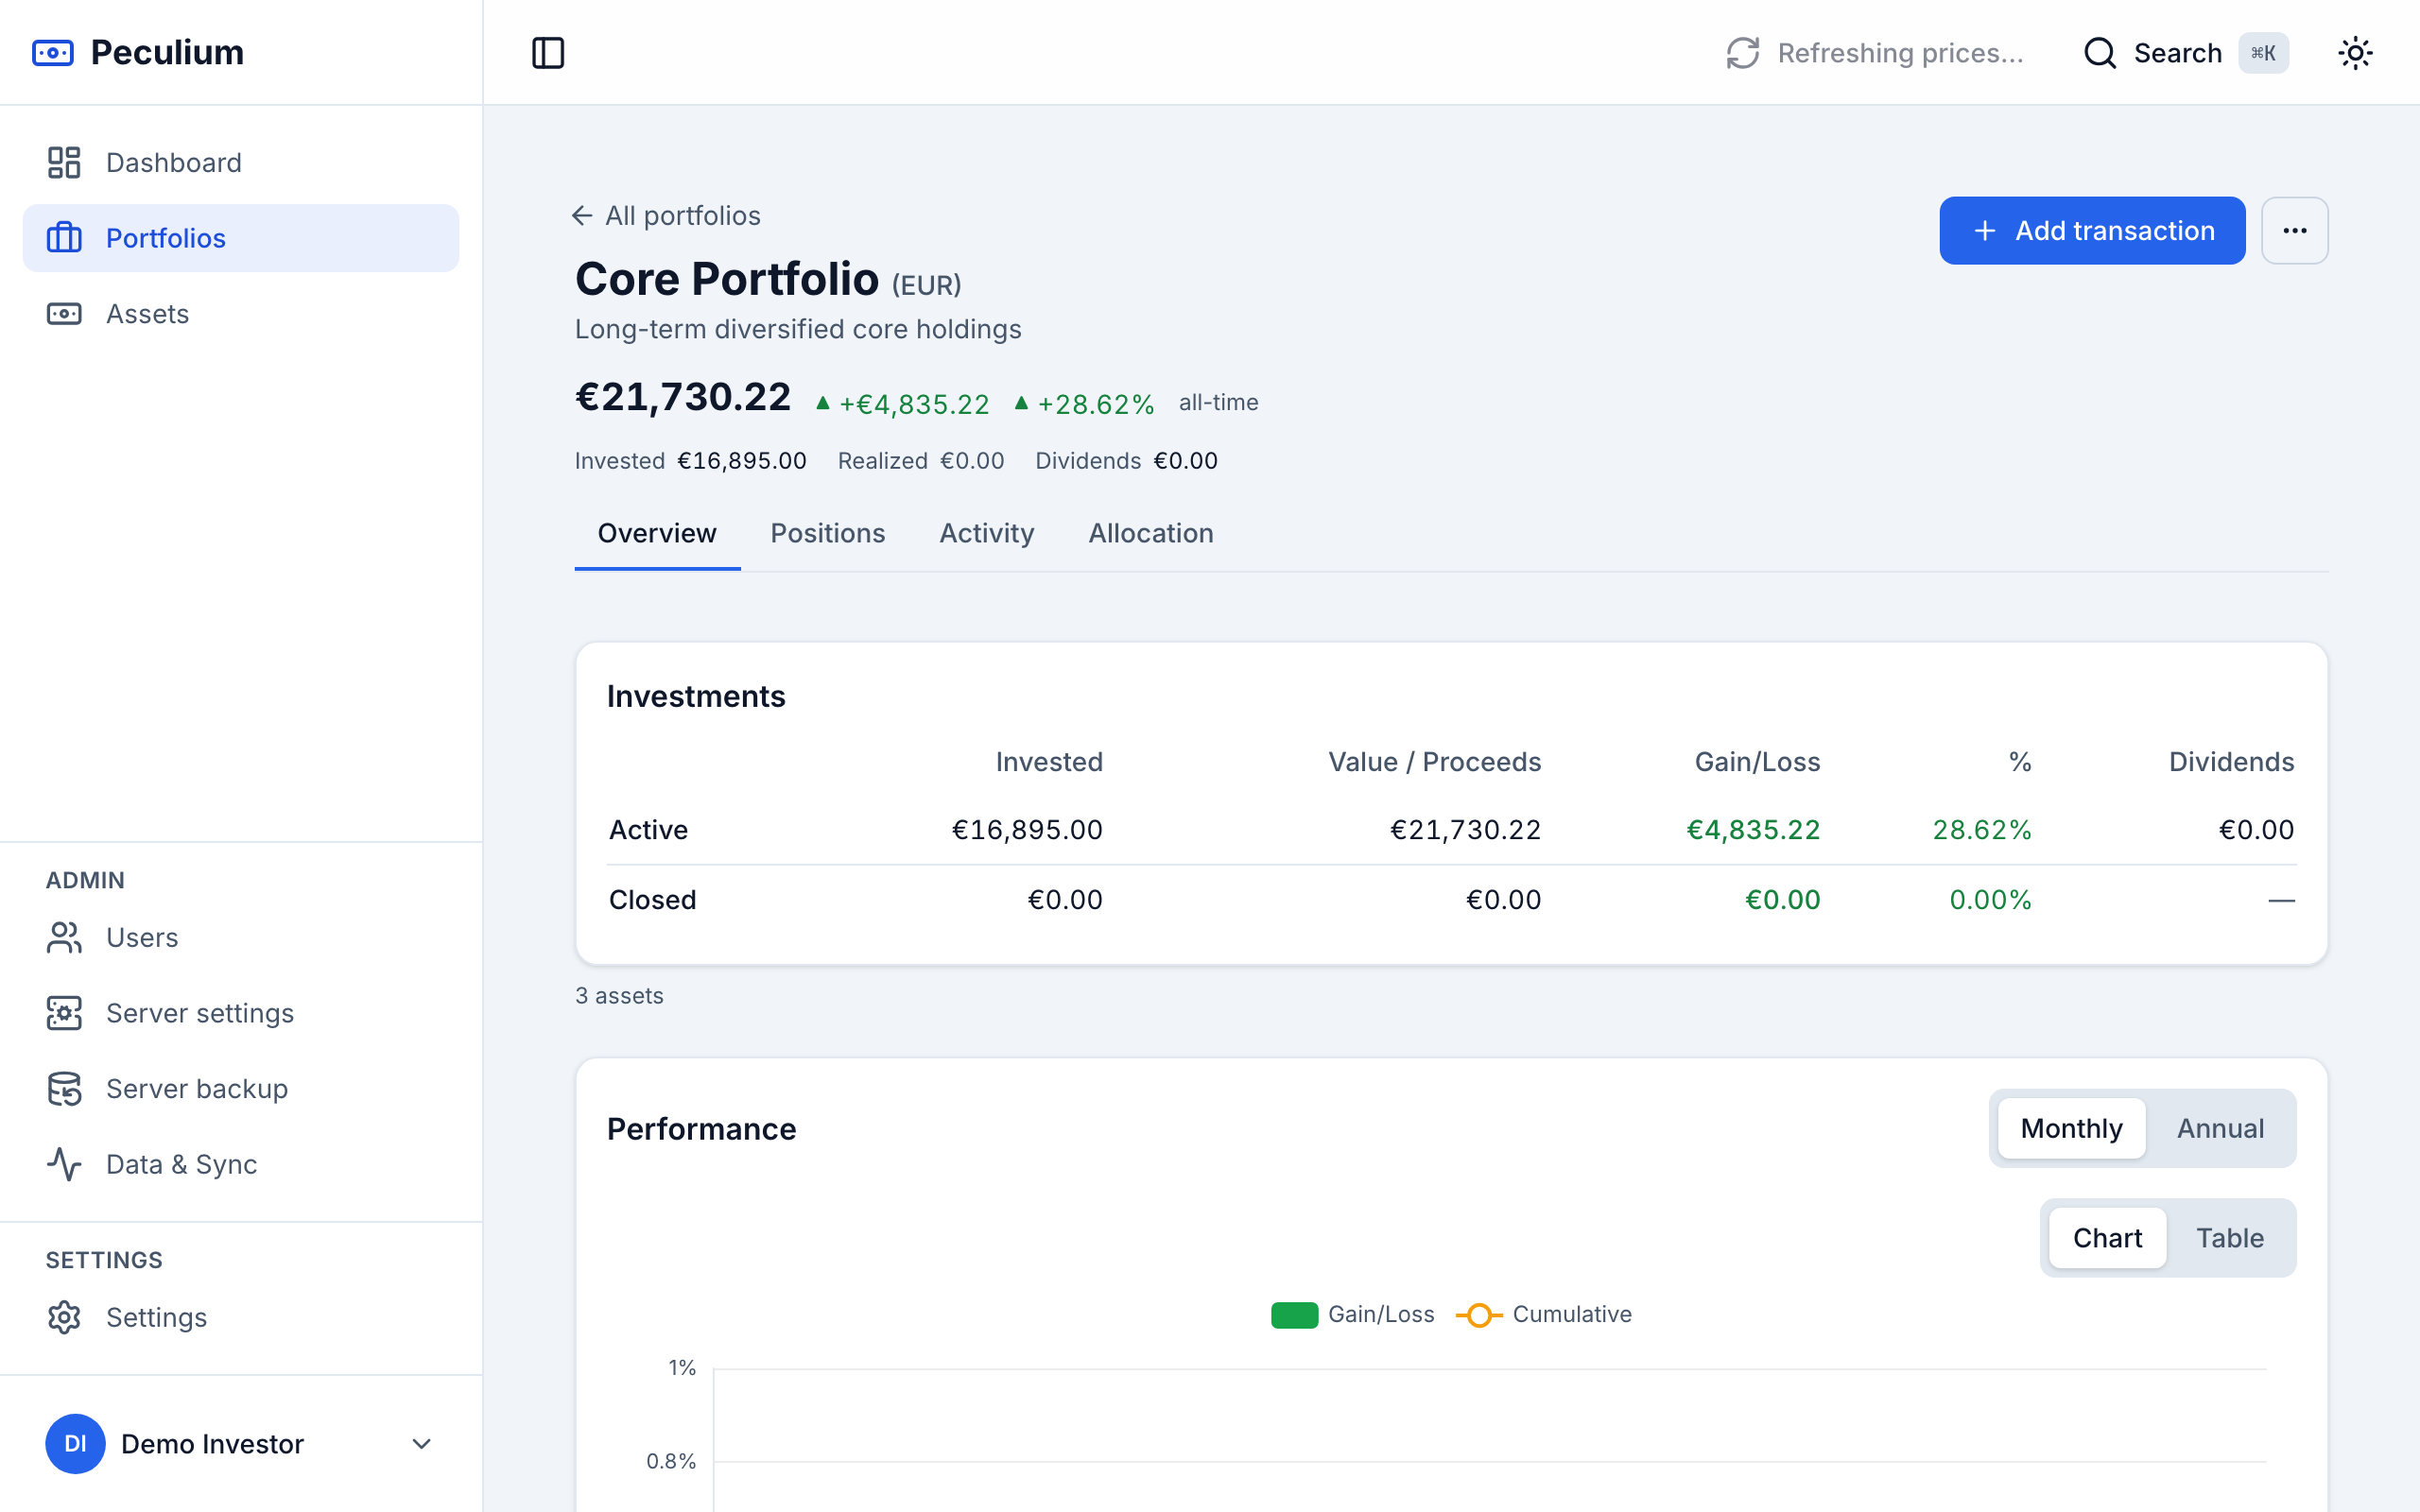
Portfolio Overview — the same KPIs computed for one portfolio.
Allocations
The Allocation tab breaks a portfolio down by asset class, by geography — Countries and Regions — and by sector. Geography and sector cover the equity universe only: non-equity holdings are excluded and the remaining equity coverage is stated, so the charts can’t silently overstate precision. The dashboard shows the same views consolidated (Overall allocation). Two interaction habits are worth learning:
- Click a slice or a bar to drill down: a panel lists the contributing assets of that bucket with their Value, Contribution and Share of slice.
- Switch any chart to its table view (Chart / Table) when you want exact numbers instead of shapes.
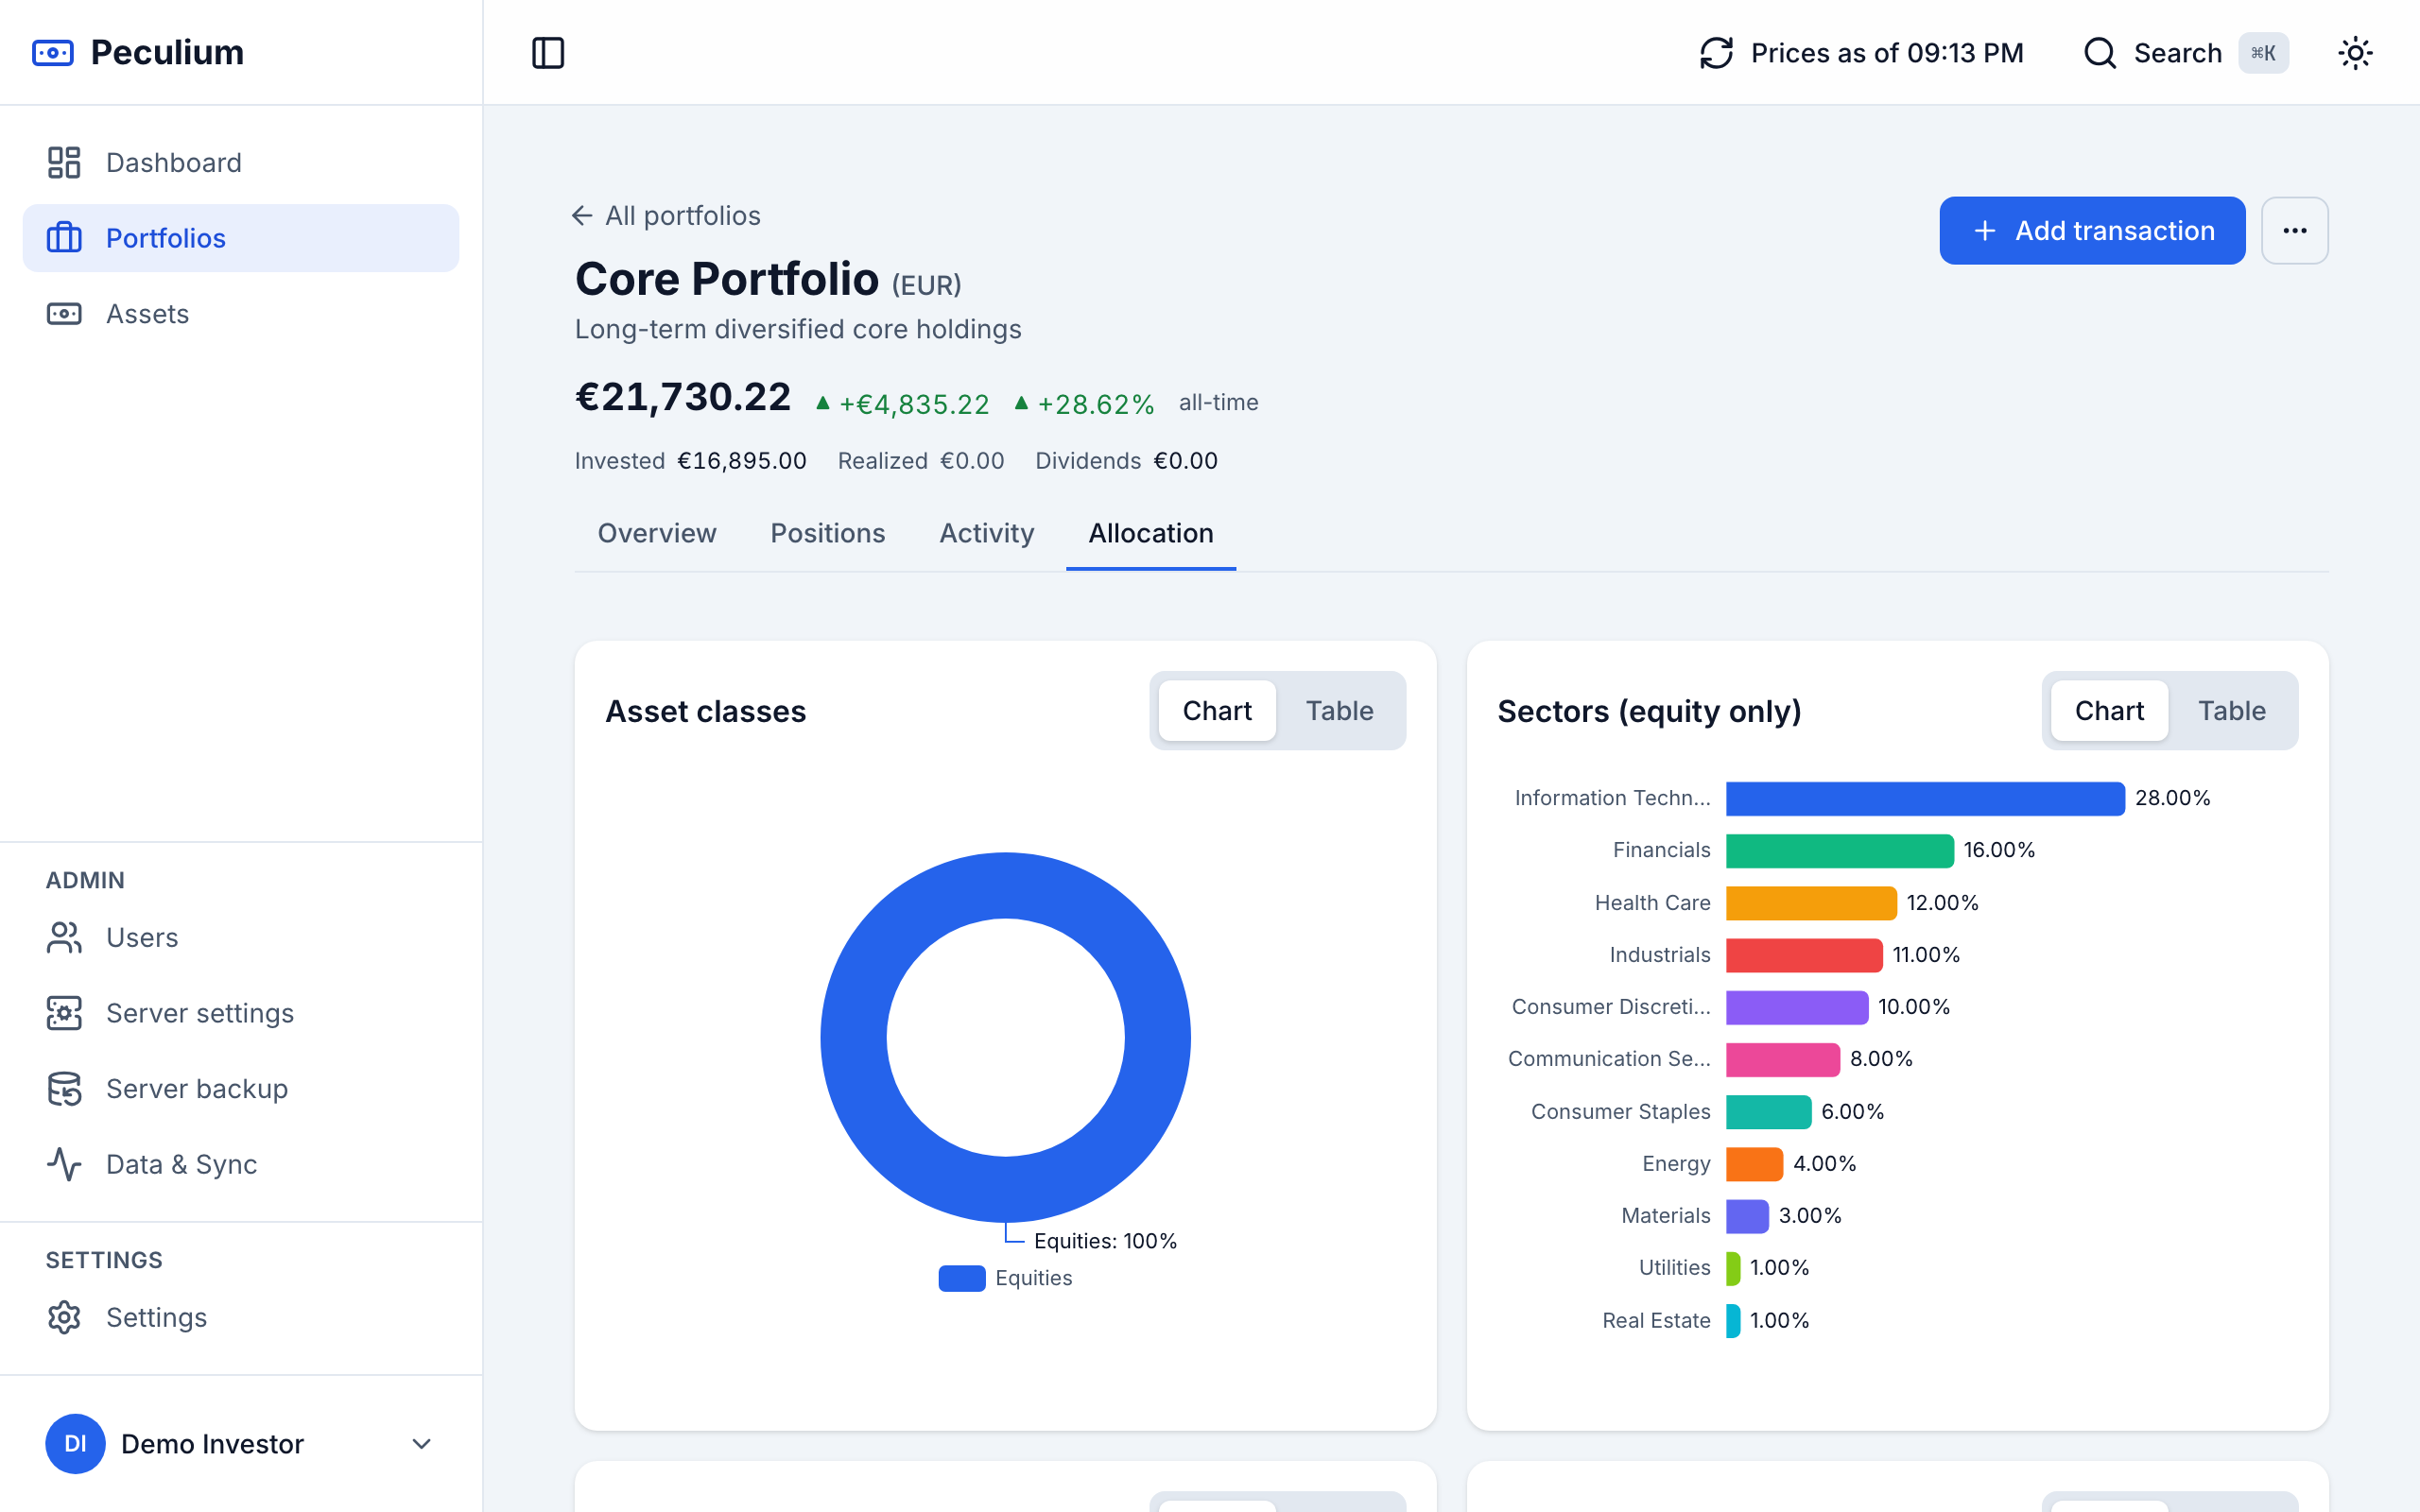
Allocation tab — donuts by class, geography and sector; click a slice to see the assets behind it.
Reading the numbers
- Active vs closed positions: a position is active while you still hold the asset; once fully sold, it closes.
- Unrealized vs realized: open positions carry the gain/loss computed on the latest price — you haven’t banked it yet. Closed positions show the realized gain/loss, fixed by the sale proceeds against cost.
- Dividends are cash income, counted separately from price movements.
- All of it is consolidated in your base currency with FX rates applied — see Concepts for how base currency and the currency whitelist work. Values use the freshest prices kept for you (the “Prices as of” stamp near the headline); holdings missing a rate are flagged and excluded rather than silently mis-converted.
Start recording — the Quickstart takes five minutes from empty instance to real charts.