
Data & sync
Every chart is only as good as the prices behind it. This chapter covers where they come from, what happens when they don’t, and how to check the sync. The currency side of the story is in Concepts; the asset page itself is covered in Daily use.
Where prices come from
Quotes come from Yahoo Finance. Peculium keeps a local price history and fetches everything from the outside world — price updates, history downloads, metadata, split checks — as background jobs: the request returns immediately and the pages update themselves as the data arrives, so a slow source never makes the app hang. The header carries a “Prices as of {time}” stamp, and the consolidated values are computed with exactly those prices. Need them right now, not later? Use Refresh prices to queue fresh quotes on demand.

The app header — the “Prices as of” stamp says which prices your numbers use.
Data quality
When a fetch doesn’t succeed, a strip of chips appears under the header — each one names the problem and links to where you can fix it: some prices were not updated (Yahoo rate limit or a partially failed update), or an amount is excluded — missing FX for a handful of holdings. Excluded beats invented: a holding without a usable rate is left out and flagged, never silently mis-converted. An asset with no price at all shows as no price: its value is carried at cost — what you paid — so its P/L reads zero instead of guessing.
Price history & completeness
Each asset page charts its stored price history and tells you how complete that history is. While a download is running you see a progress bar instead of an empty chart, and it refreshes itself as bars arrive. When the history is missing, the chart offers a Backfill full history button; when it is only partially downloaded, a note says so with the same button to complete it. Backfill is also available any time from the asset’s Data tab. The same tab carries Update from Yahoo, which refreshes the asset’s metadata rather than its prices.
Different exchanges close at different times, so each asset’s latest close can carry a different date — that is normal. The assets list shows each asset’s last close with its date, and the asset page labels that date “Data as of {date}”.
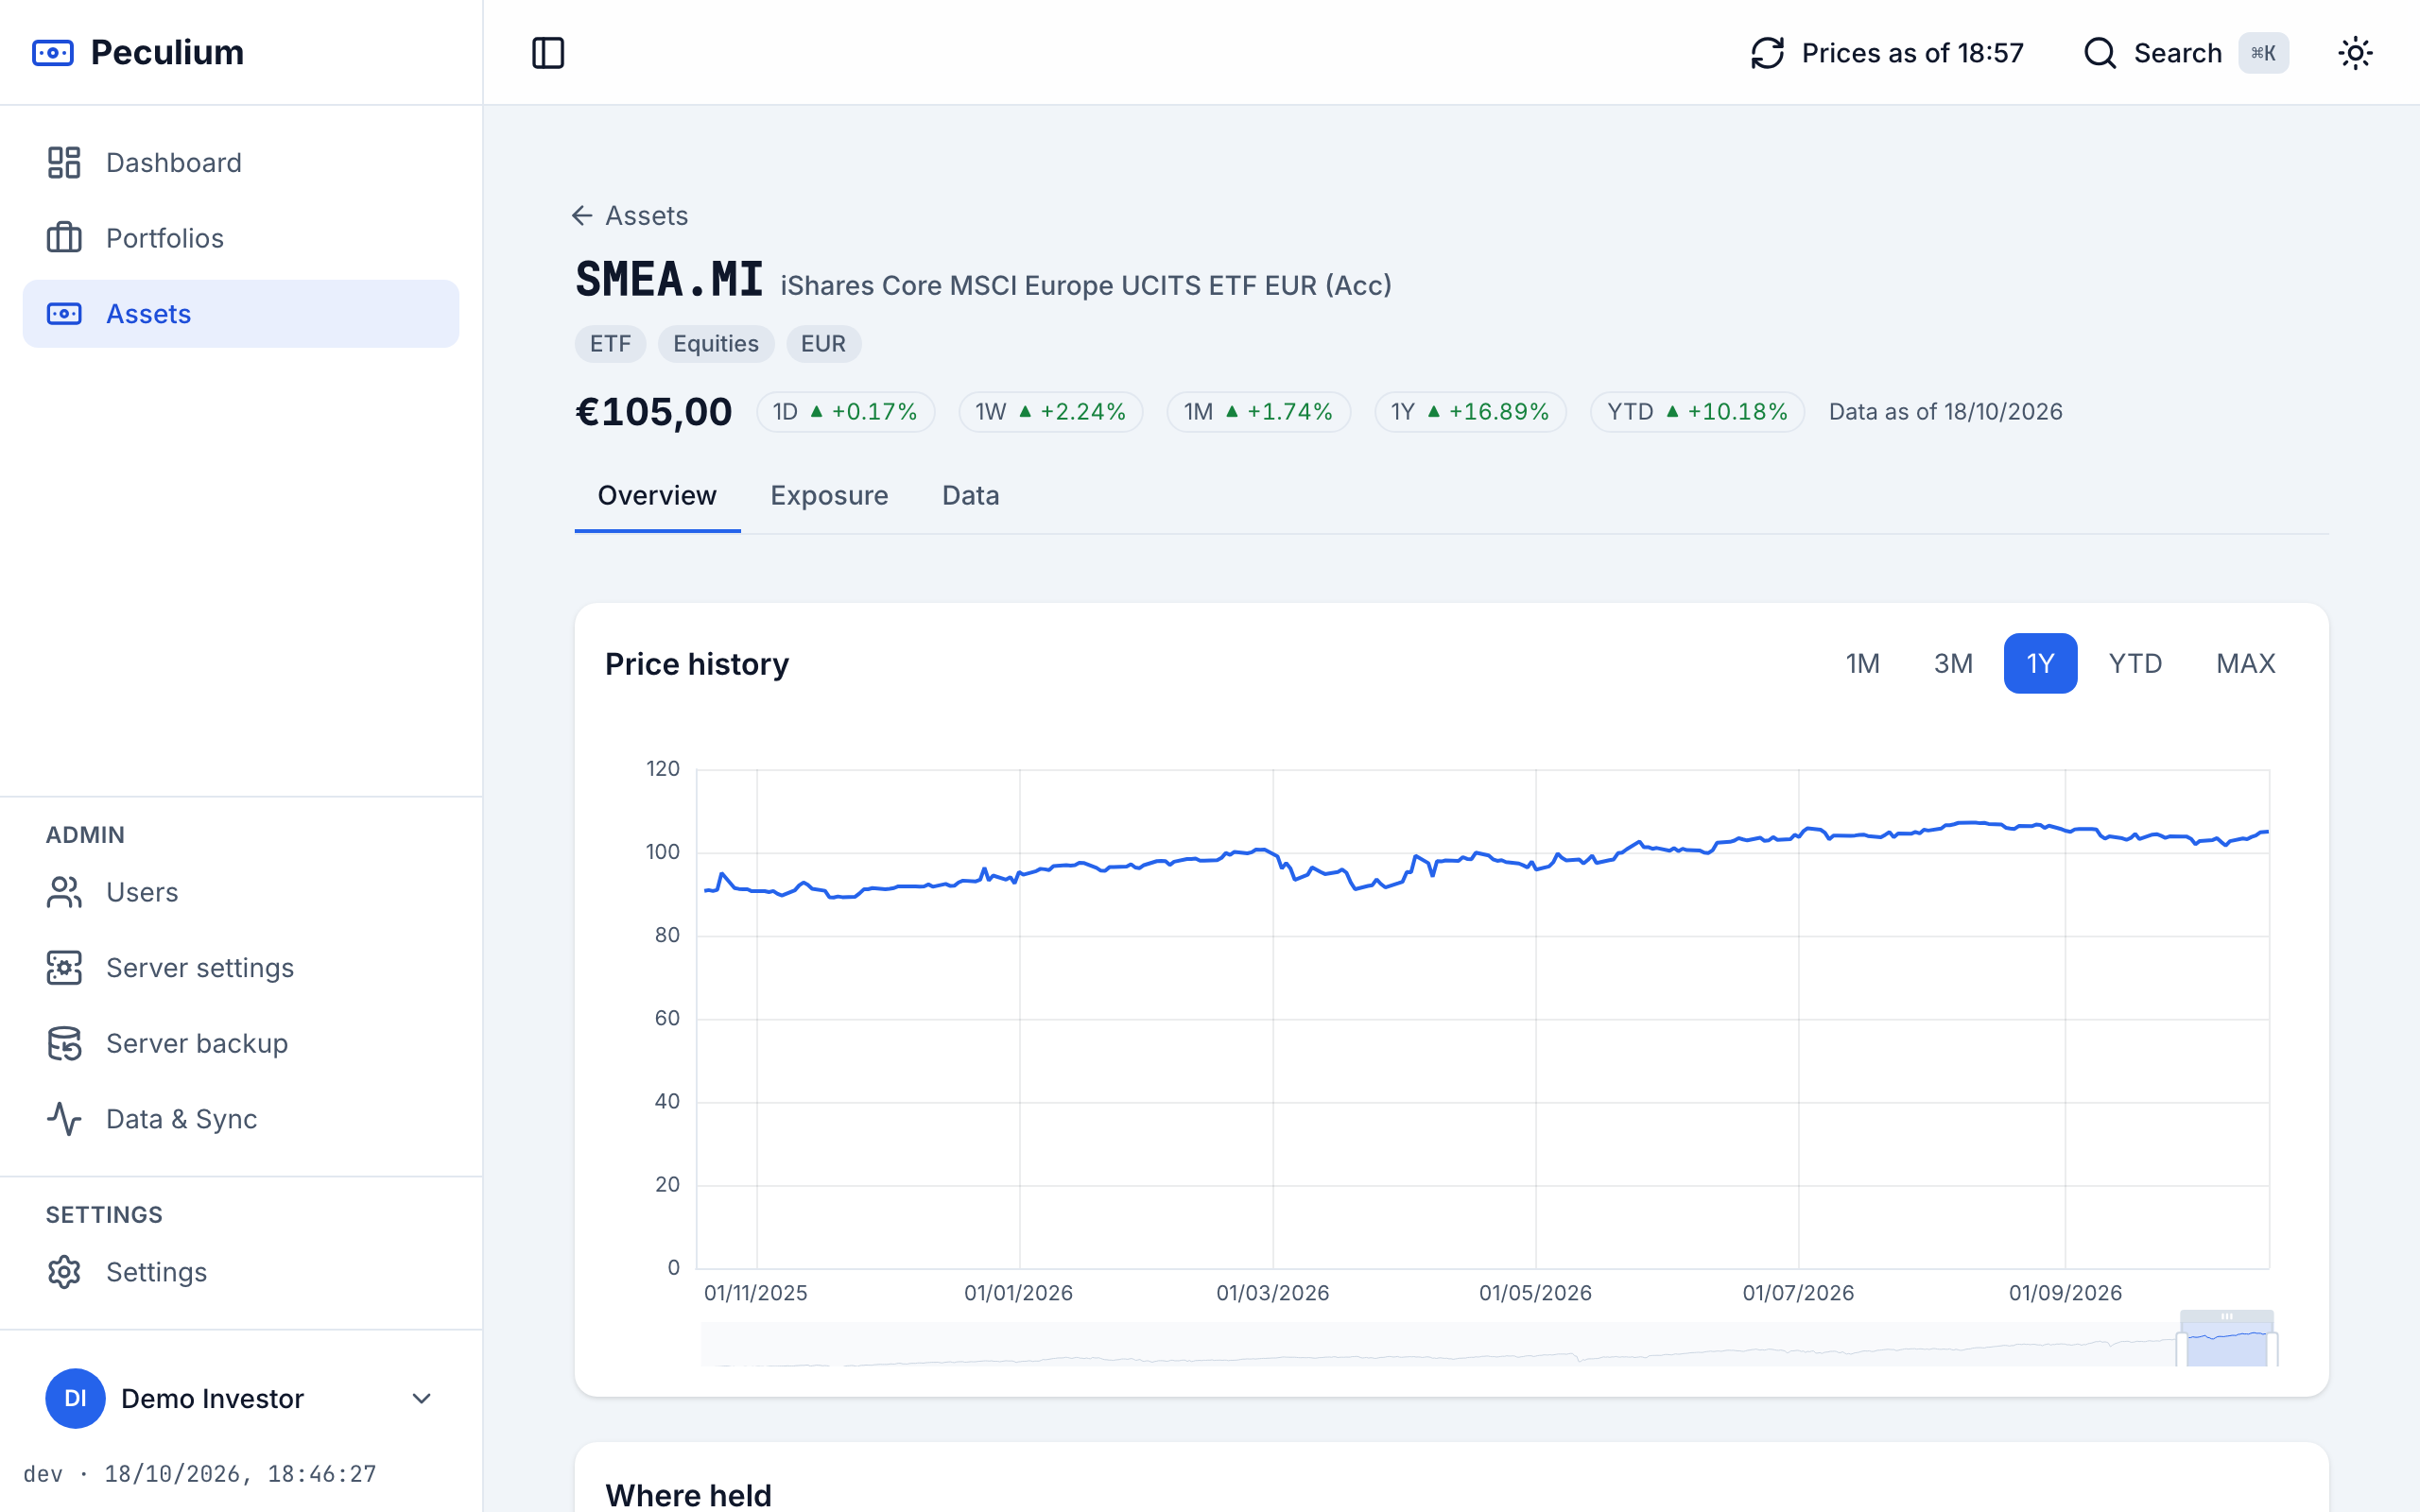
Price history — backfill pulls the whole series as a background job.
Price source per asset
The asset’s Data tab decides where its prices come from:
- Yahoo Finance — the default: automatic quotes and backfill. Use it for anything Yahoo lists by ticker.
- Manual price — record dated prices by hand, for assets without an automatic feed (an unlisted fund, a relative’s fixed-rate bond).
- No price — opt the asset out: it stays carried at cost, valued at what you invested.
The Data & Sync page
Data & Sync in the sidebar is one list of everything the app does with the outside world: each background job (price refresh, history backfill, asset sync, metadata backfill, splits fetch) appears as one row with its progress or error, and every individual provider call — prices, FX, splits, searches, ETF exposure lookups — appears next to it, newest first. Each job names its target: the asset ticker or the portfolio name.
- The window selector — 24h / 7 days / All — scopes the summary tiles (success rate, successes, failures, rate limited) and the list together, so the numbers always match what is listed.
- Type and Status filters cut the list down, for example to the failures of one call type only.
- While jobs are running the page auto-refreshes; finish now or press Refresh Now to re-poll immediately.
- Open a job to see its own calls in a side panel right next to the list — the detail of what it fetched, what failed and how long it took.
- Activity older than 90 days is removed automatically, so the page never grows without bound; an administrator can also wipe the whole activity with the Clear activity button after a confirmation.
When a quality chip keeps coming back, this page tells you whether Yahoo is grumbling generally or one specific asset is failing.
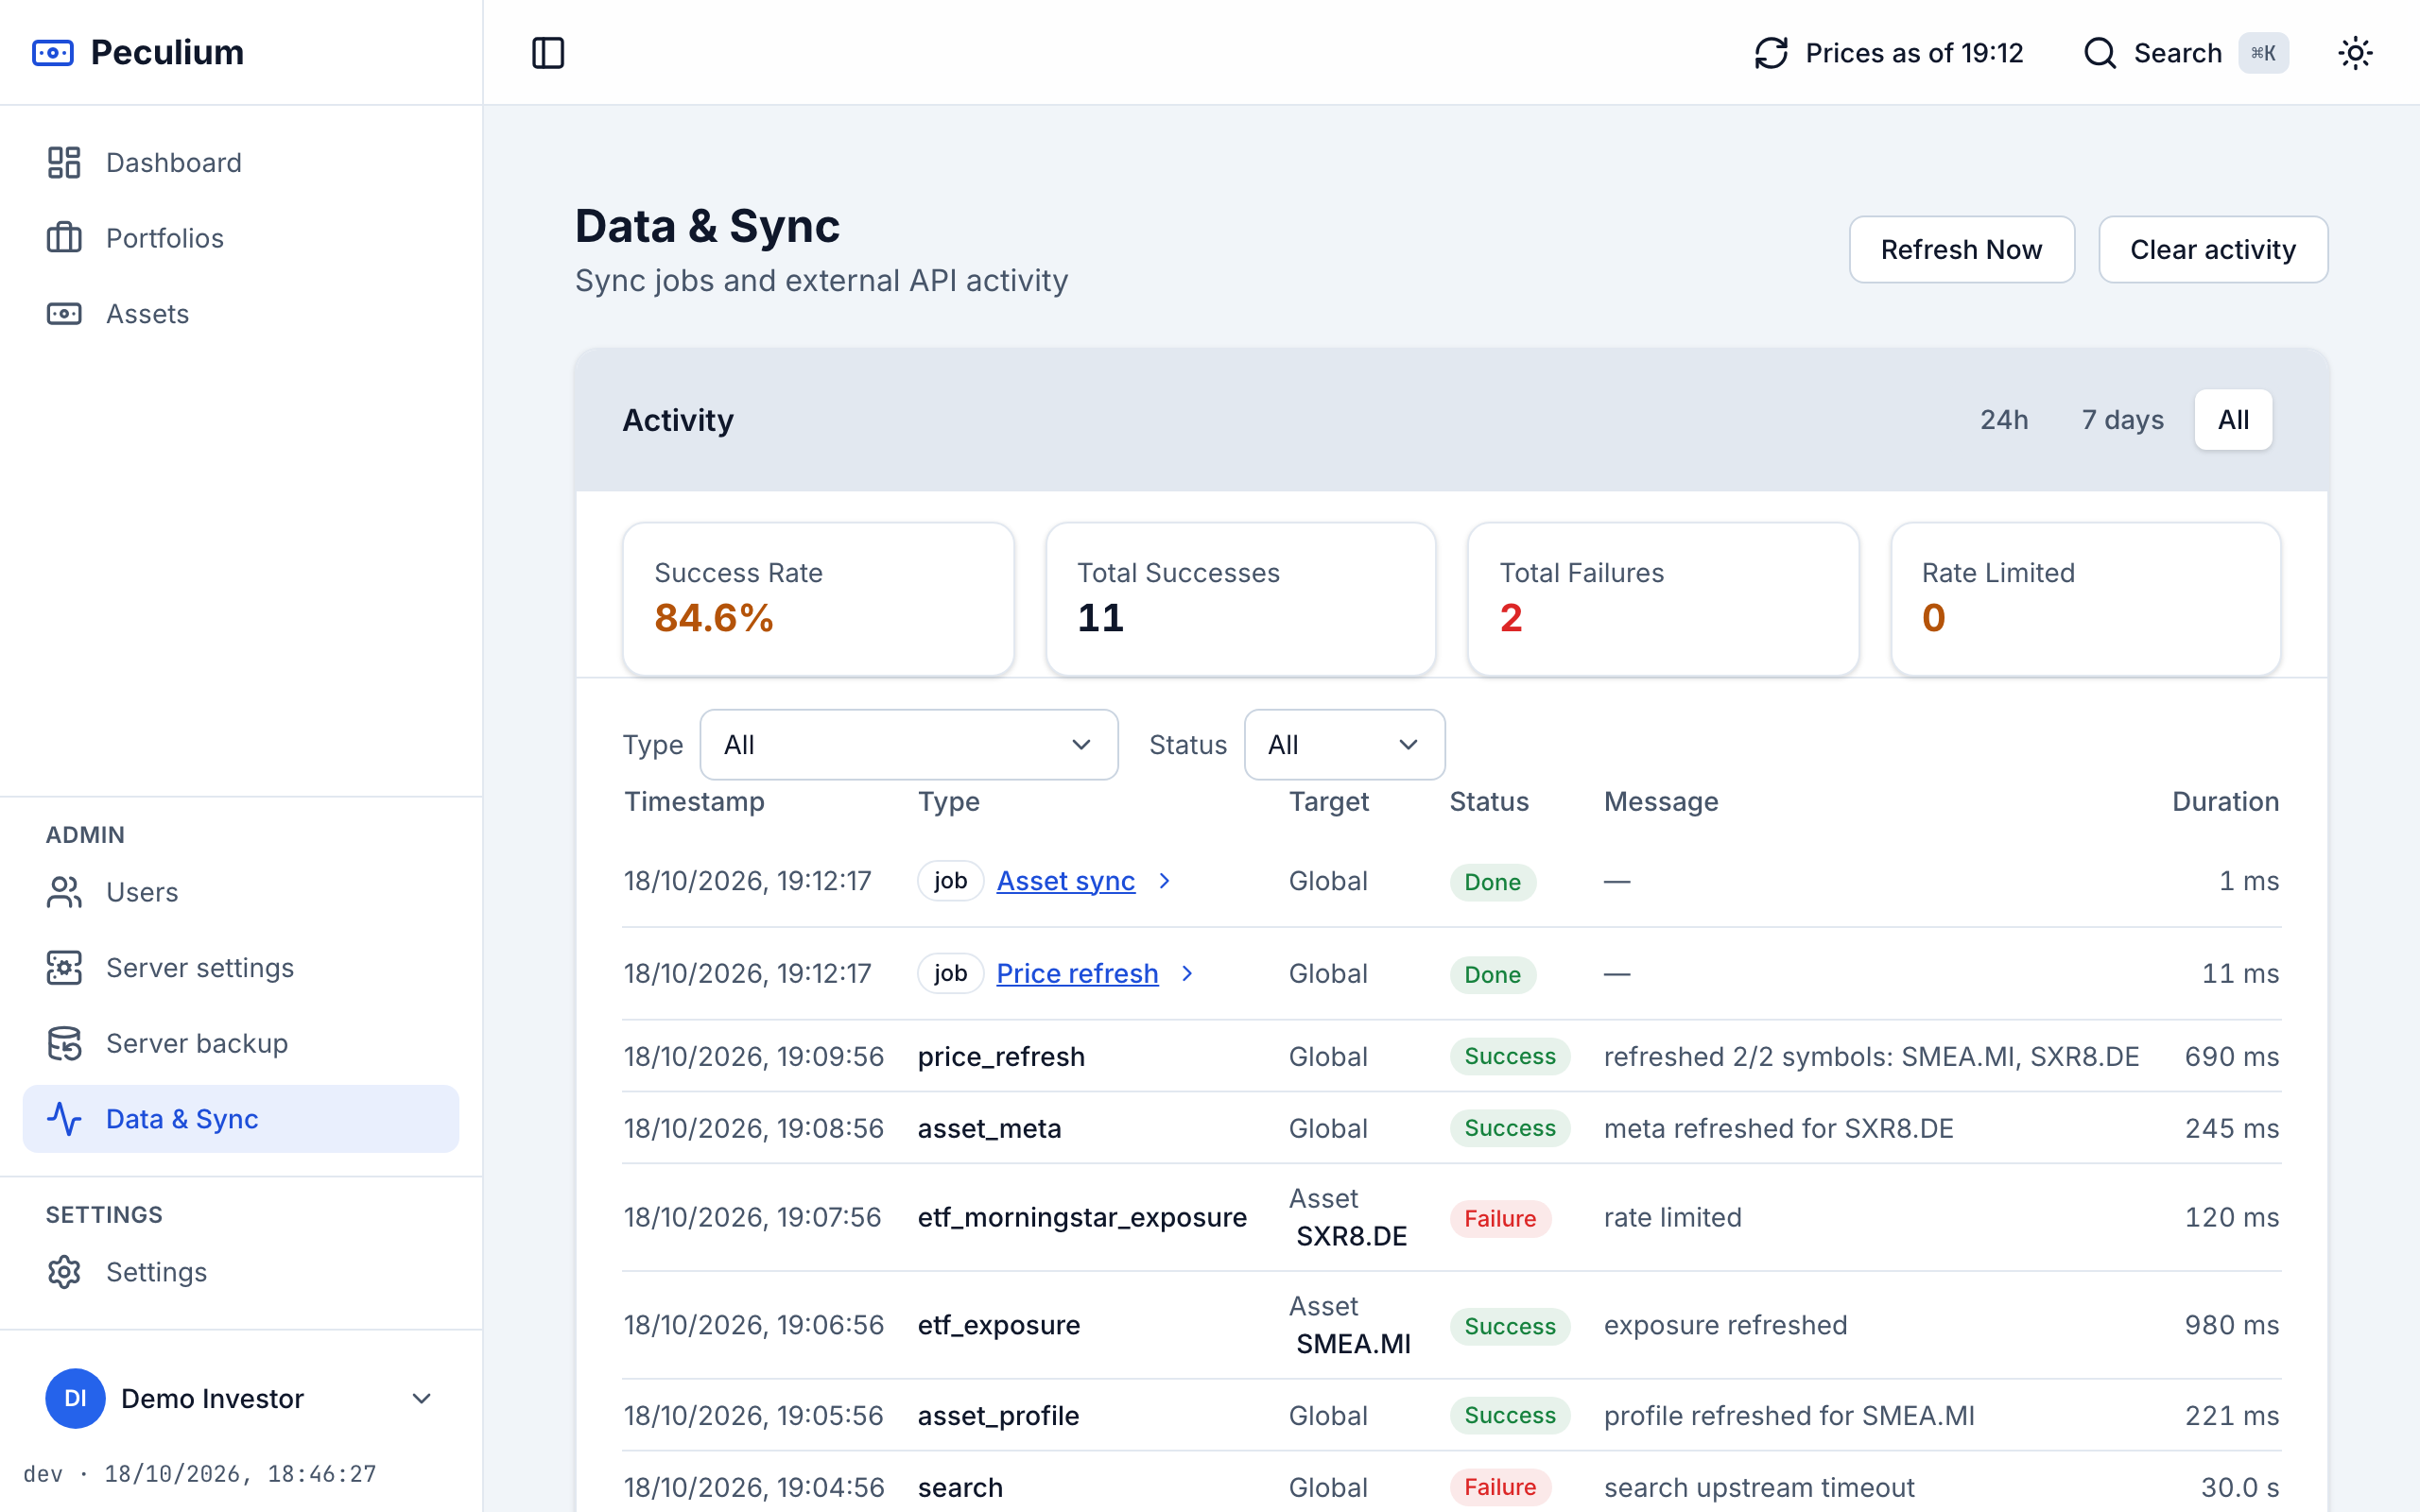
Data & Sync — jobs and provider calls in one activity list, with the window selector, filters and summary tiles.
A quiet sync means honest charts: check Dashboard & analytics for what the numbers then tell you about your portfolios.