
Daily use
The Quickstart got you running and Concepts explains the model; this chapter is the day-to-day loop you’ll actually live in.
Recording a transaction
Open a portfolio and click Add transaction. The dialog offers the three everyday types — buy, sell and dividend — and the ledger keeps split (a stock split: the share count changes, no cash moves) and fee (a cost on its own, not part of a trade) as first-class types alongside them. Fields: the asset, the type, quantity and price (a dividend takes an amount instead), and the date; fees and notes are optional.
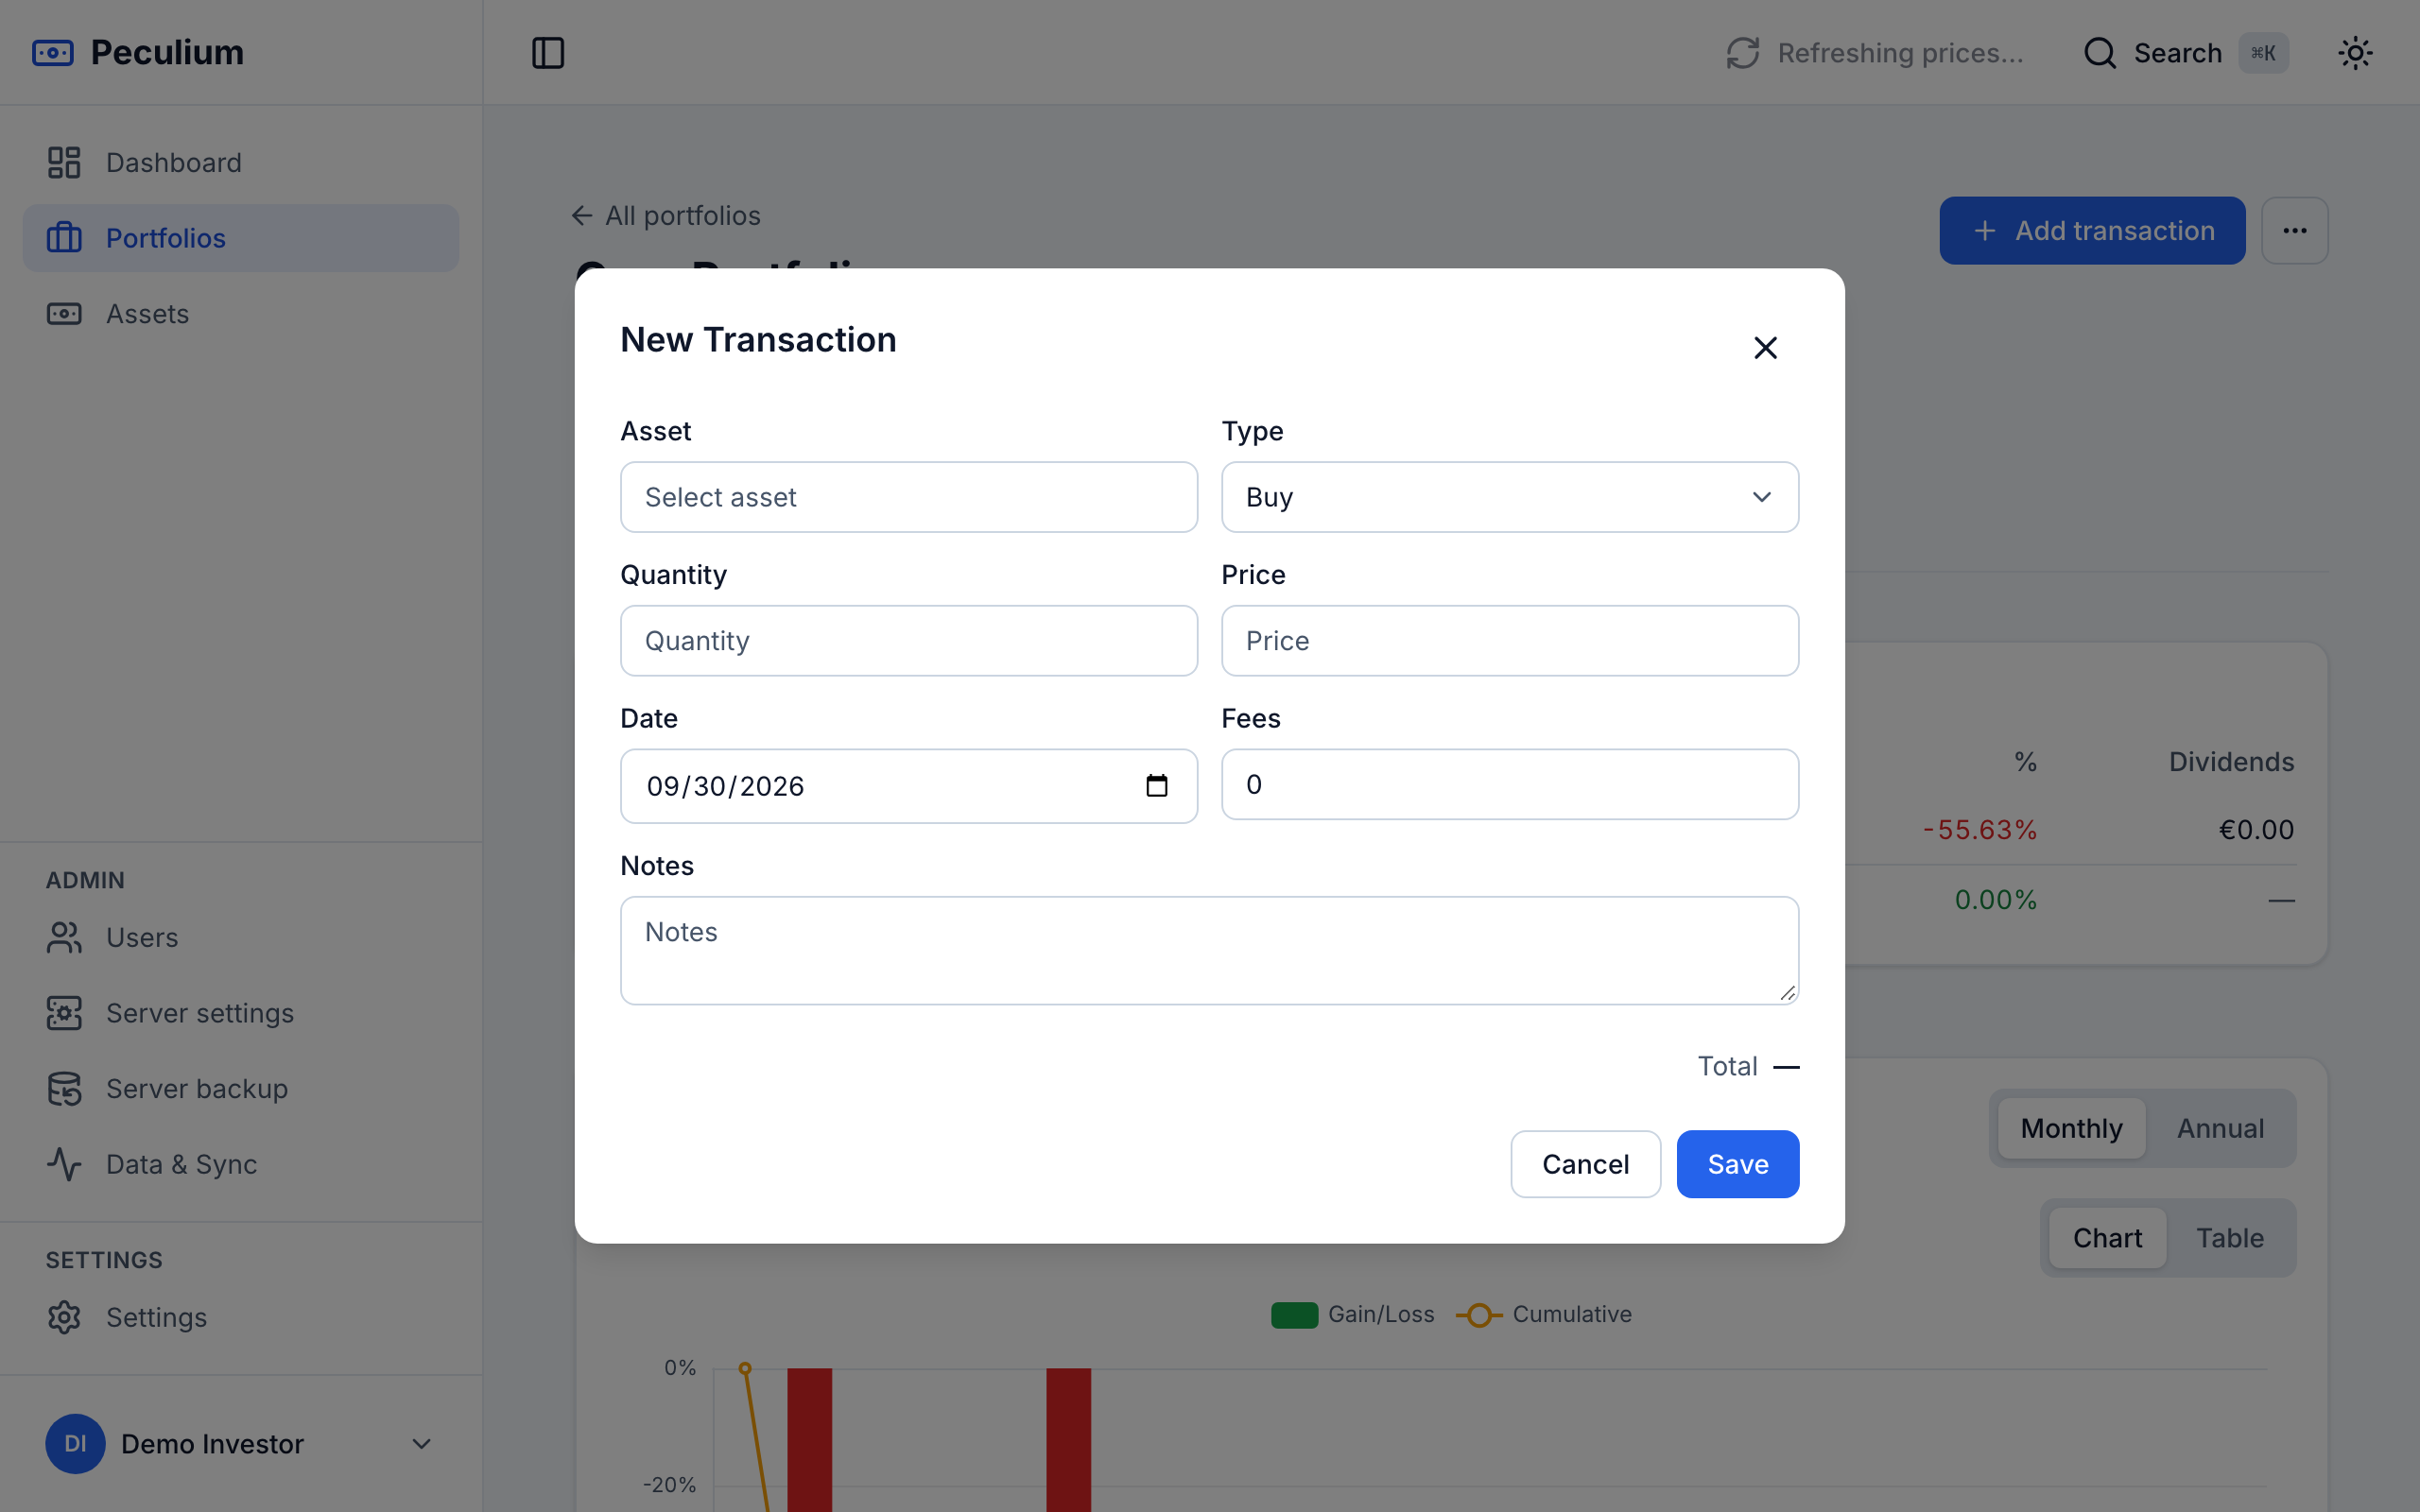
Add transaction — pick the asset and type, fill in quantity, price and date.
The Activity list
Every transaction of a portfolio lives on its Activity tab. Filter it by type (the chips), by asset, and by date range (From / To), and clear everything with Clear filters. The filters are written into the tab’s URL, so a filtered view can be bookmarked or shared as a link — it reopens exactly as you left it.
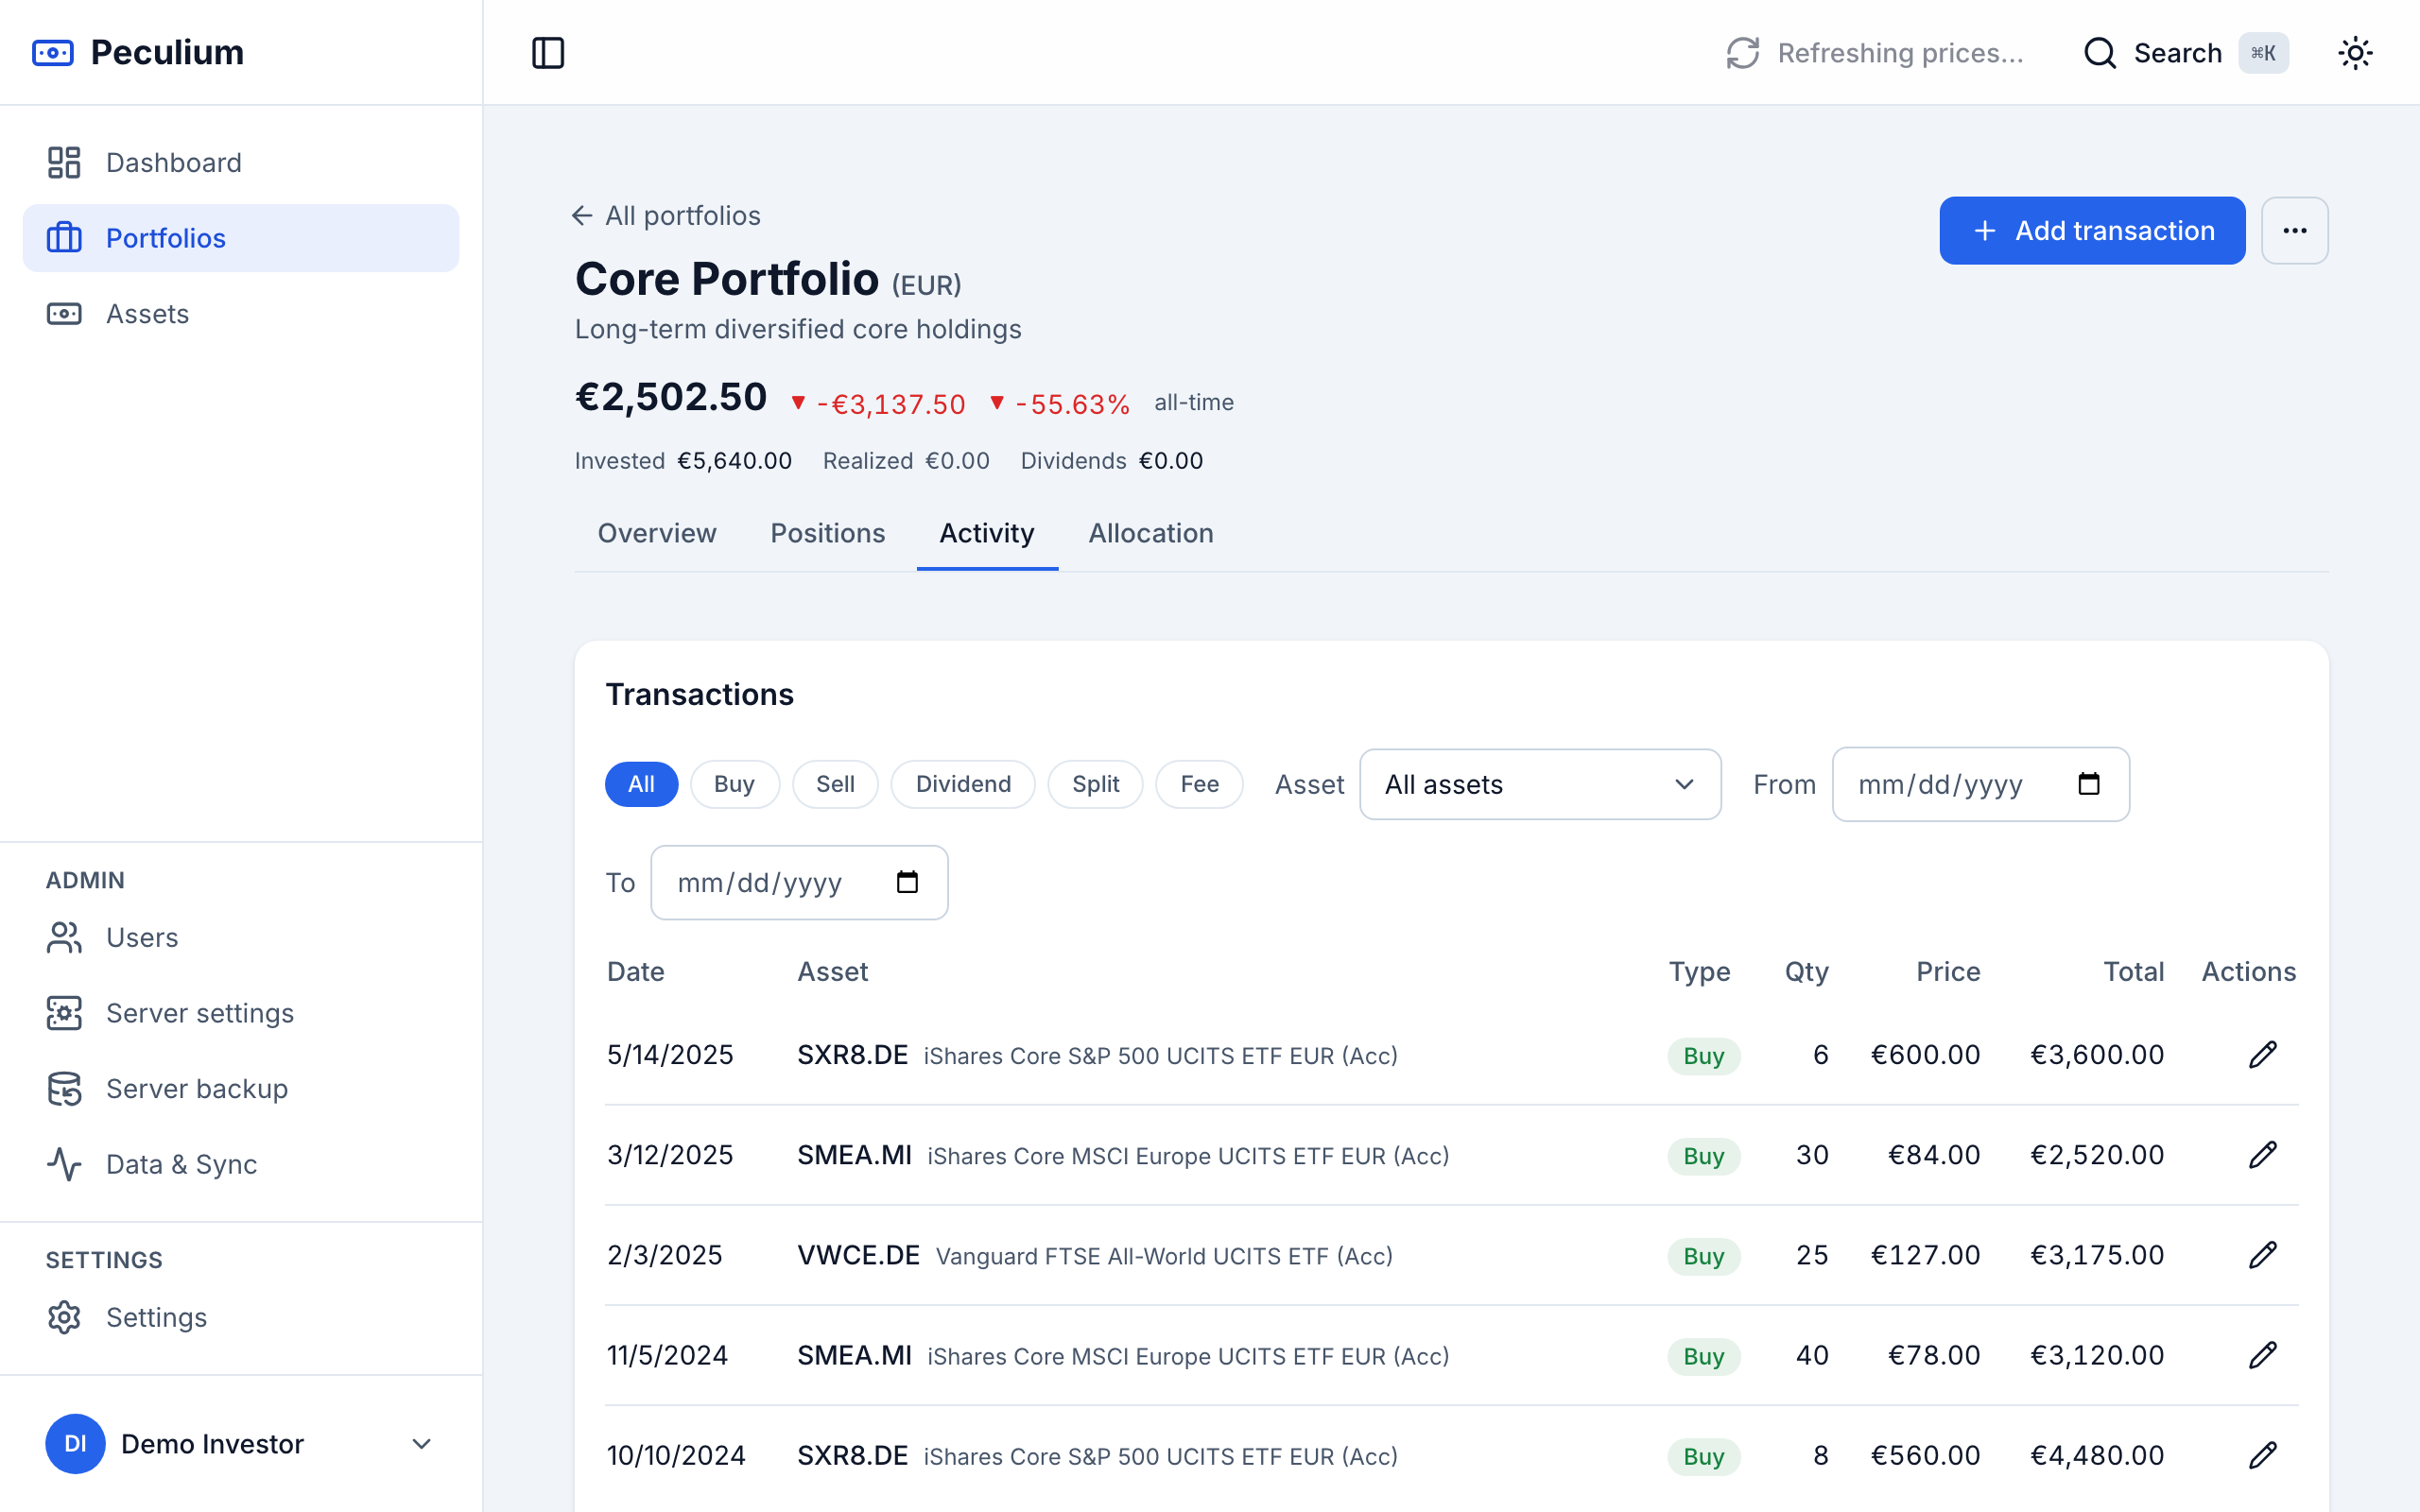
Activity — type chips, asset picker and date range, all persisted in the URL.
Editing or deleting a transaction
Mis-recorded something? The edit button on the row reopens the entry in the same dialog, pre-filled. Deleting asks for confirmation, and the toast that follows keeps an Undo action for a short window — click it and the transaction is back, no re-typing.
Editing an asset
Click any asset to open its page and switch to the Data tab: name, type, exchange, ISIN, asset class and the price source (Yahoo Finance, a manual price, or none). From the same page you can refresh the metadata from Yahoo and backfill the price history.
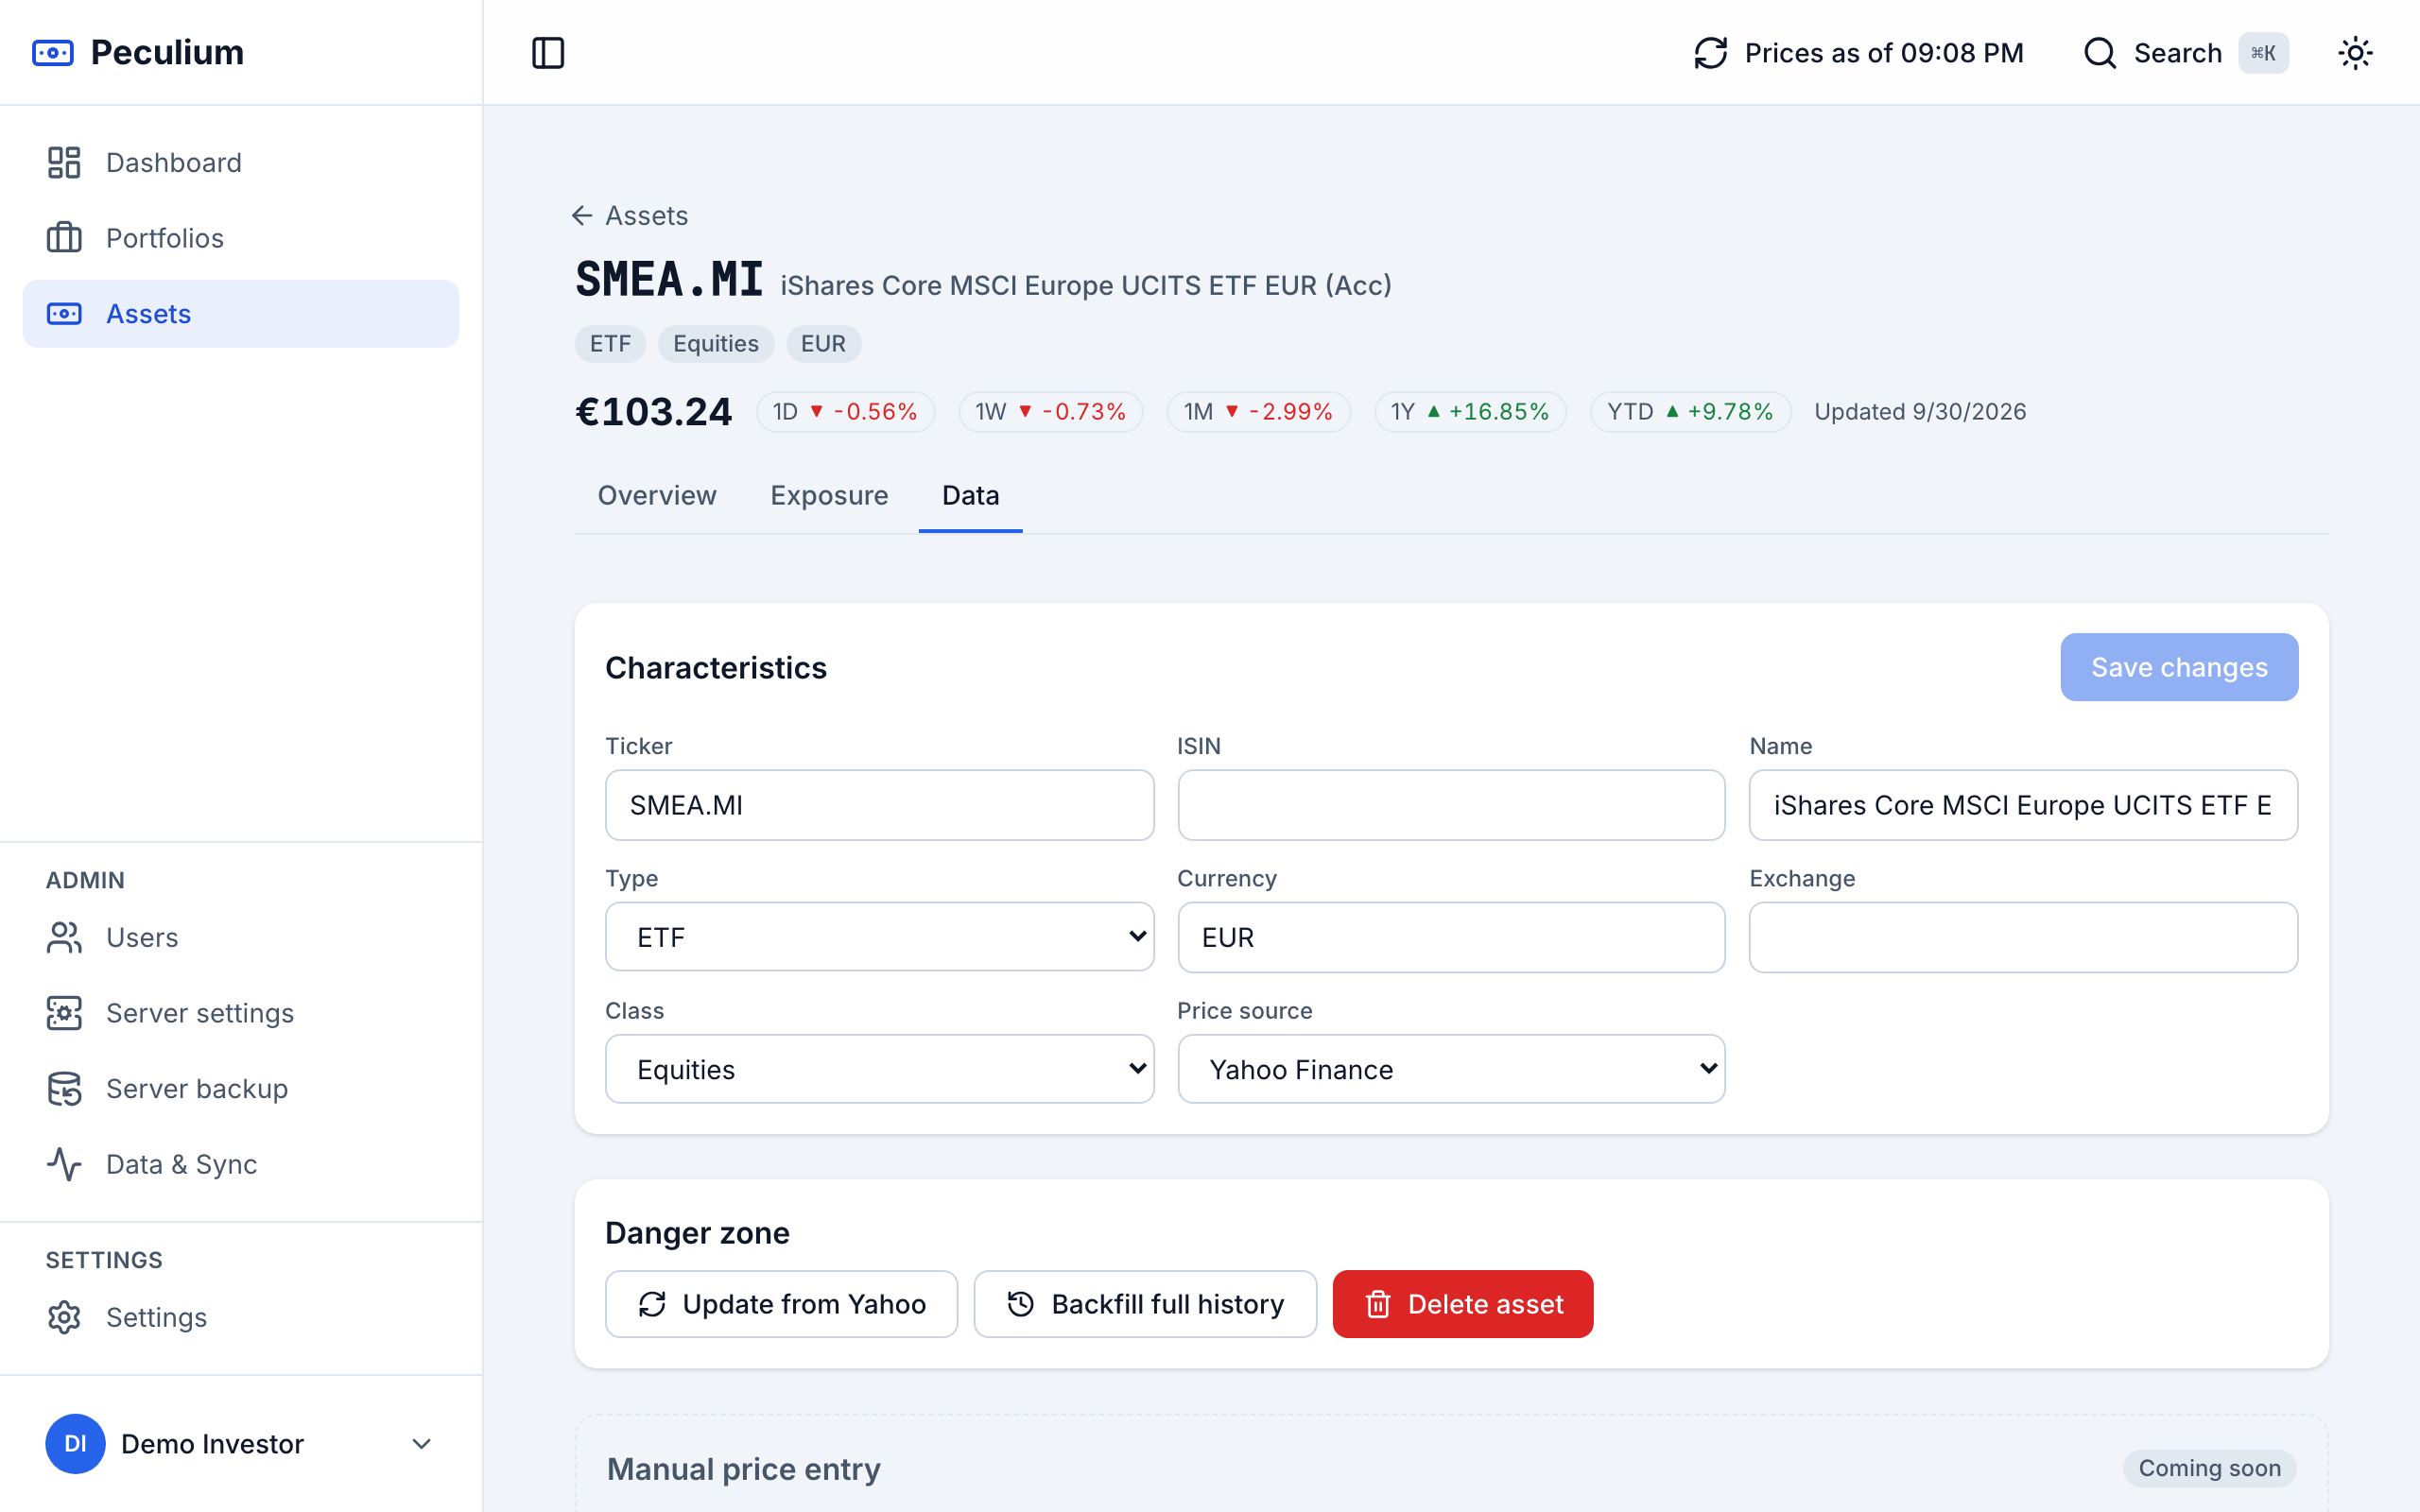
The Data tab — everything about an asset is editable here.
Editing exposure
For equity assets and ETFs, the Exposure tab holds the geography (Countries and Regions) and Sector weights. Edit the tables with Edit geographic distribution and Edit sector distribution — or prefill them from JustETF, Morningstar or Yahoo — and the donut charts preview the result as you type. The allocation charts across the app are built on these weights.
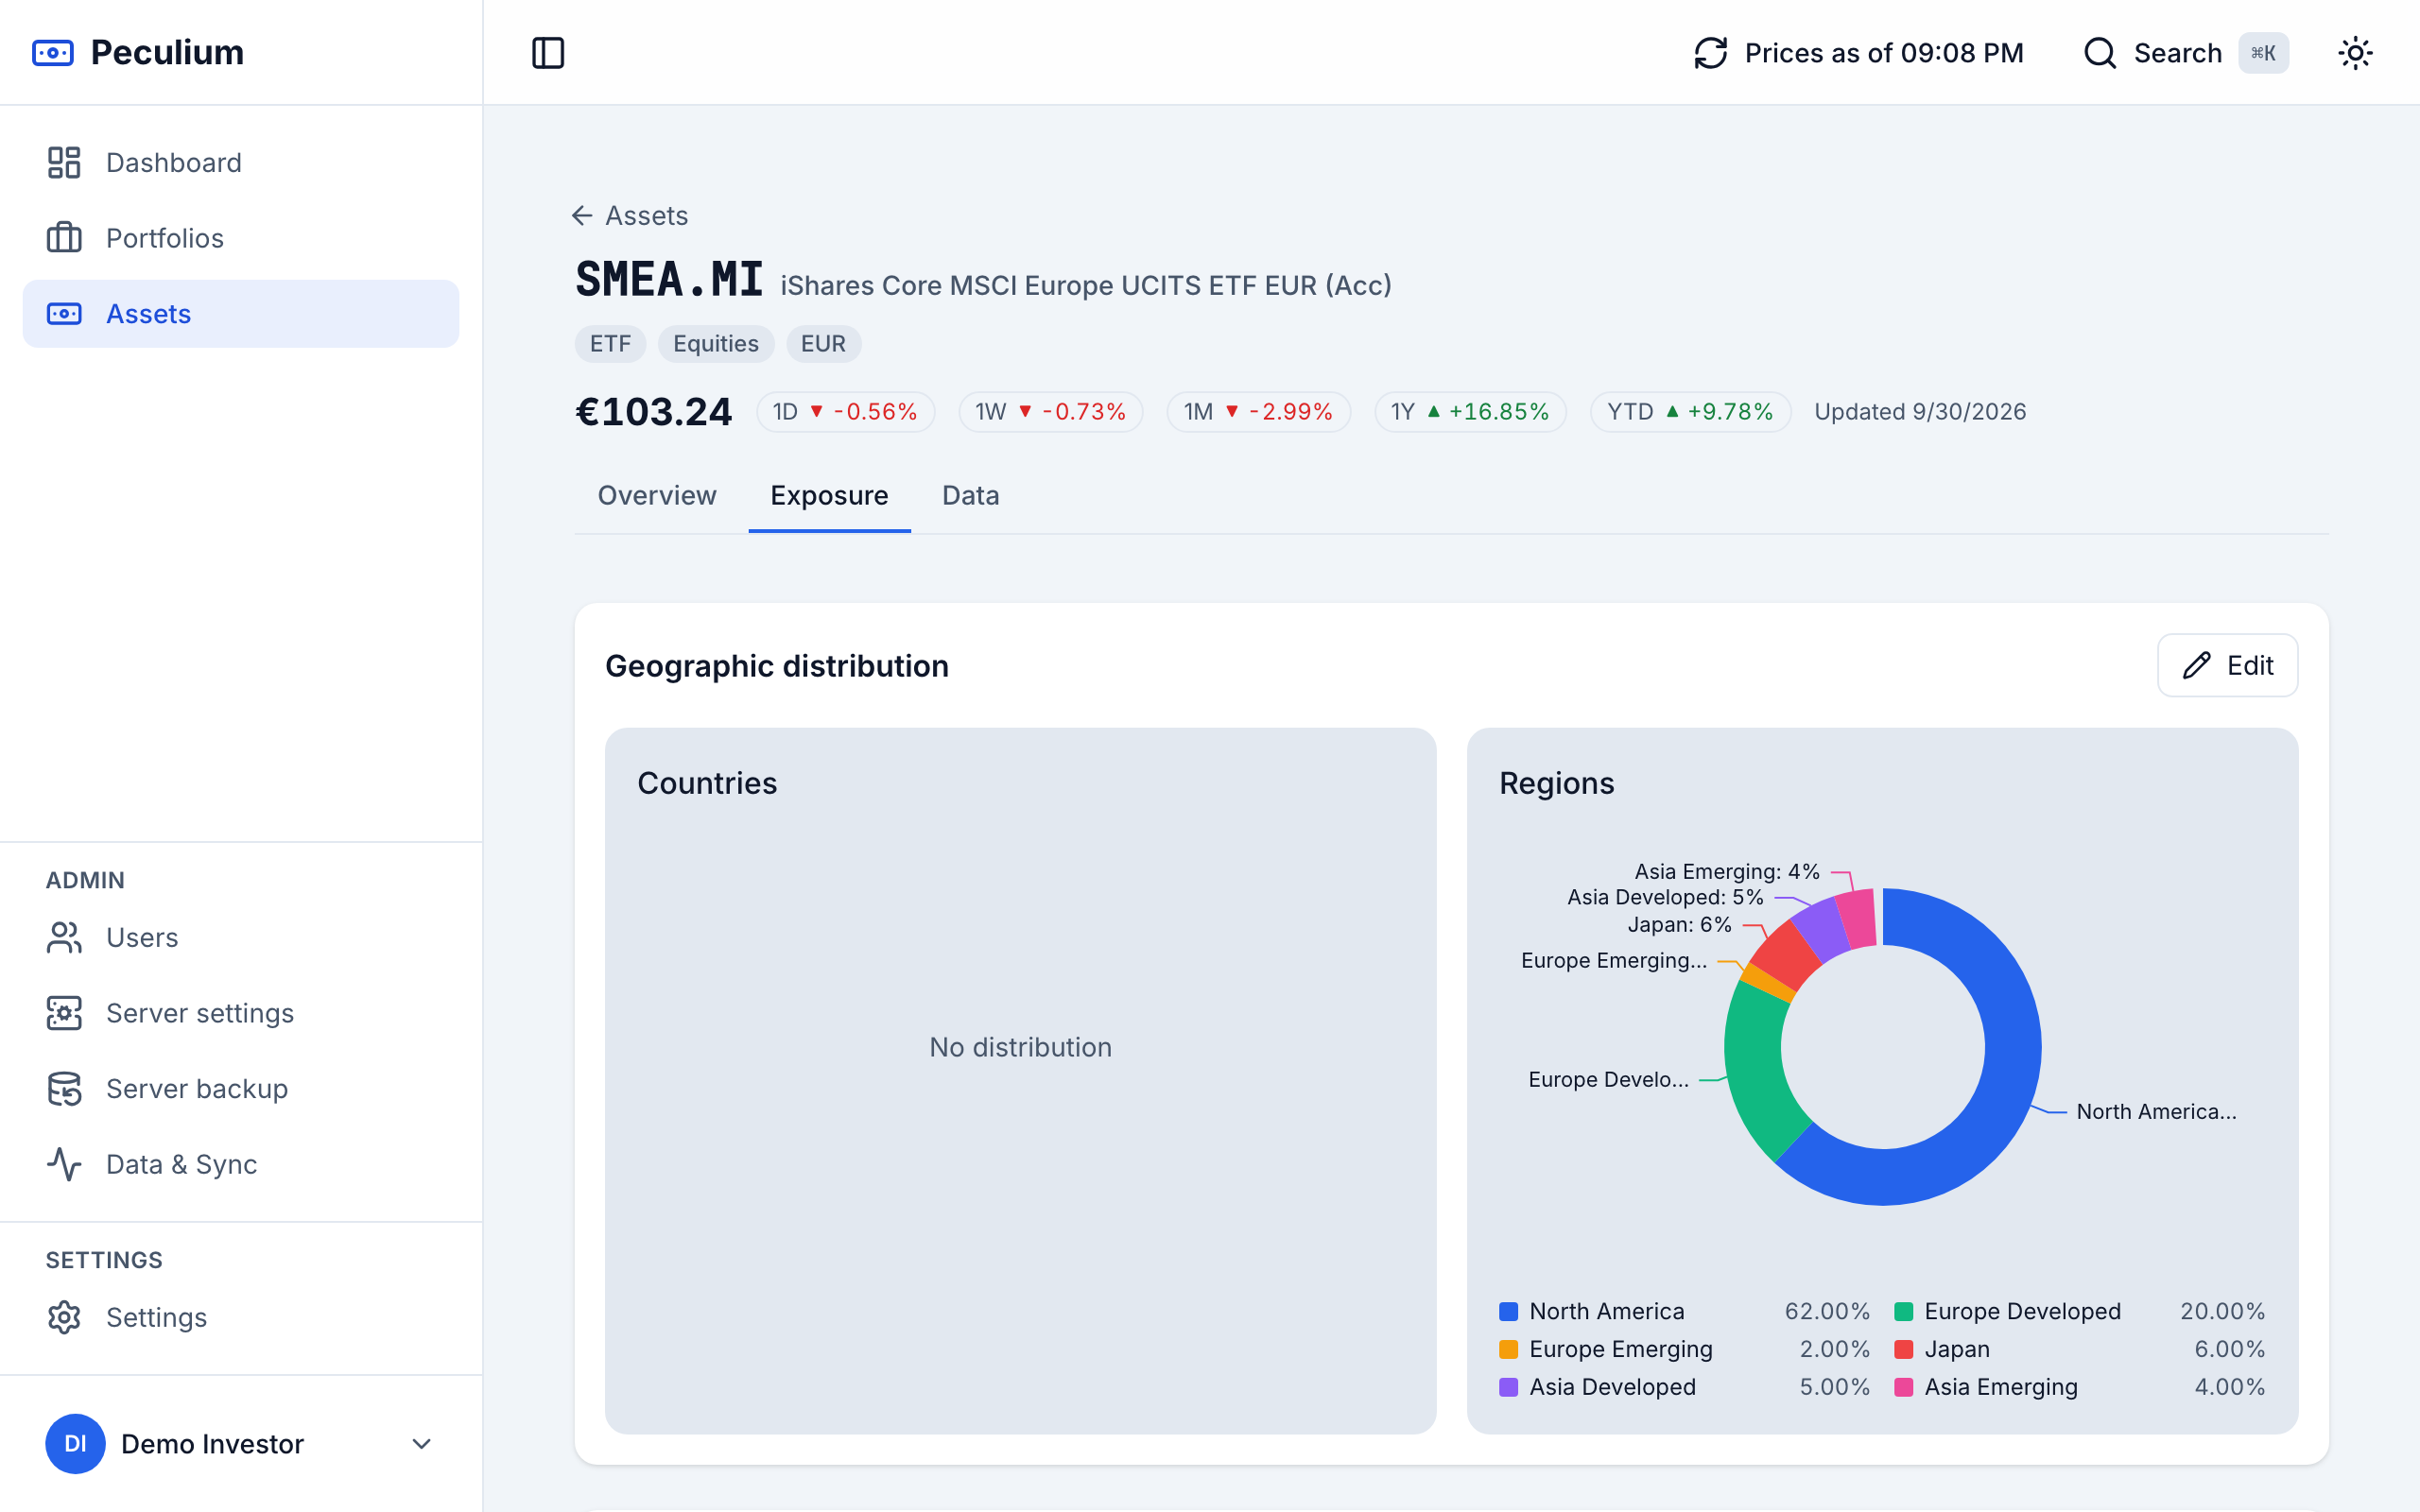
The Exposure tab — editable country, region and sector weights with live chart preview.
These workflows feed the numbers on your dashboard; the Quickstart shows the shortest path through them, and the install guide covers keeping the stack itself up to date.